Sriram P R

Industrial UX & HMI design Enterprise product experiences Interfaces for industrial AI & design systems

Designing clear, scalable and user-centred digital experiences across enterprise products, industrial intelligence platforms and AI-enabled operational systems. Now looking for a senior industrial UX, enterprise product design or UX lead role.

  • Enterprise UX
  • Industrial HMI
  • AI-assisted workflows
  • Design systems
  • Prototyping
Portrait of Sriram P R

10+ years of professional experience, including 7+ in UX and product-experience design

About

I'm a UX professional with 10+ years of professional experience, including 7+ years designing digital products, enterprise workflows and user-centred interfaces. My work is about taking problems that are genuinely complex and making them clear and practical to use, in ways that also serve the business.

That work spans UX strategy, UI design, product thinking and cross-functional collaboration. I like being the person who aligns design, engineering and business teams so an idea can move from concept to delivery with clarity and consistency.

Right now I focus on intelligent experiences for Industrial AI, HMI and digital-twin systems: interfaces that help people understand operations, spot issues early and make decisions with confidence. Most of the work in this portfolio was produced for an industrial intelligence platform, where I also contributed to HMI colour documentation and design-system consistency.

I have mentored two team members from a beginner starting point to working independently, building their domain knowledge, practical skills, confidence and ownership.

Work

Selected work across dashboards, HMI interfaces, enterprise products and interactive concepts, shaped with product, engineering and business teams. Each project is about simplifying a complex workflow and making operations easier to read and act on.

Where the work sits

  • Enterprise UX & experience architecture

    Structuring complex business workflows and infrastructure so people can find their way through them.

    See A2, E3, D4

  • HMI, industrial interfaces & digital twins

    Operator-facing screens and equipment representations that make machine state and the right action obvious.

    See B1 to B4, E1, E2

  • Dashboards, data visualization & operational intelligence

    Turning event streams, sensor data and KPIs into views that separate now from over time, and summary from detail.

    See C1 to C10, D1

  • Concept prototyping & proof-of-value

    Scenario-driven prototypes that let customers evaluate a capability before it is built.

    See A1, E4 to E7

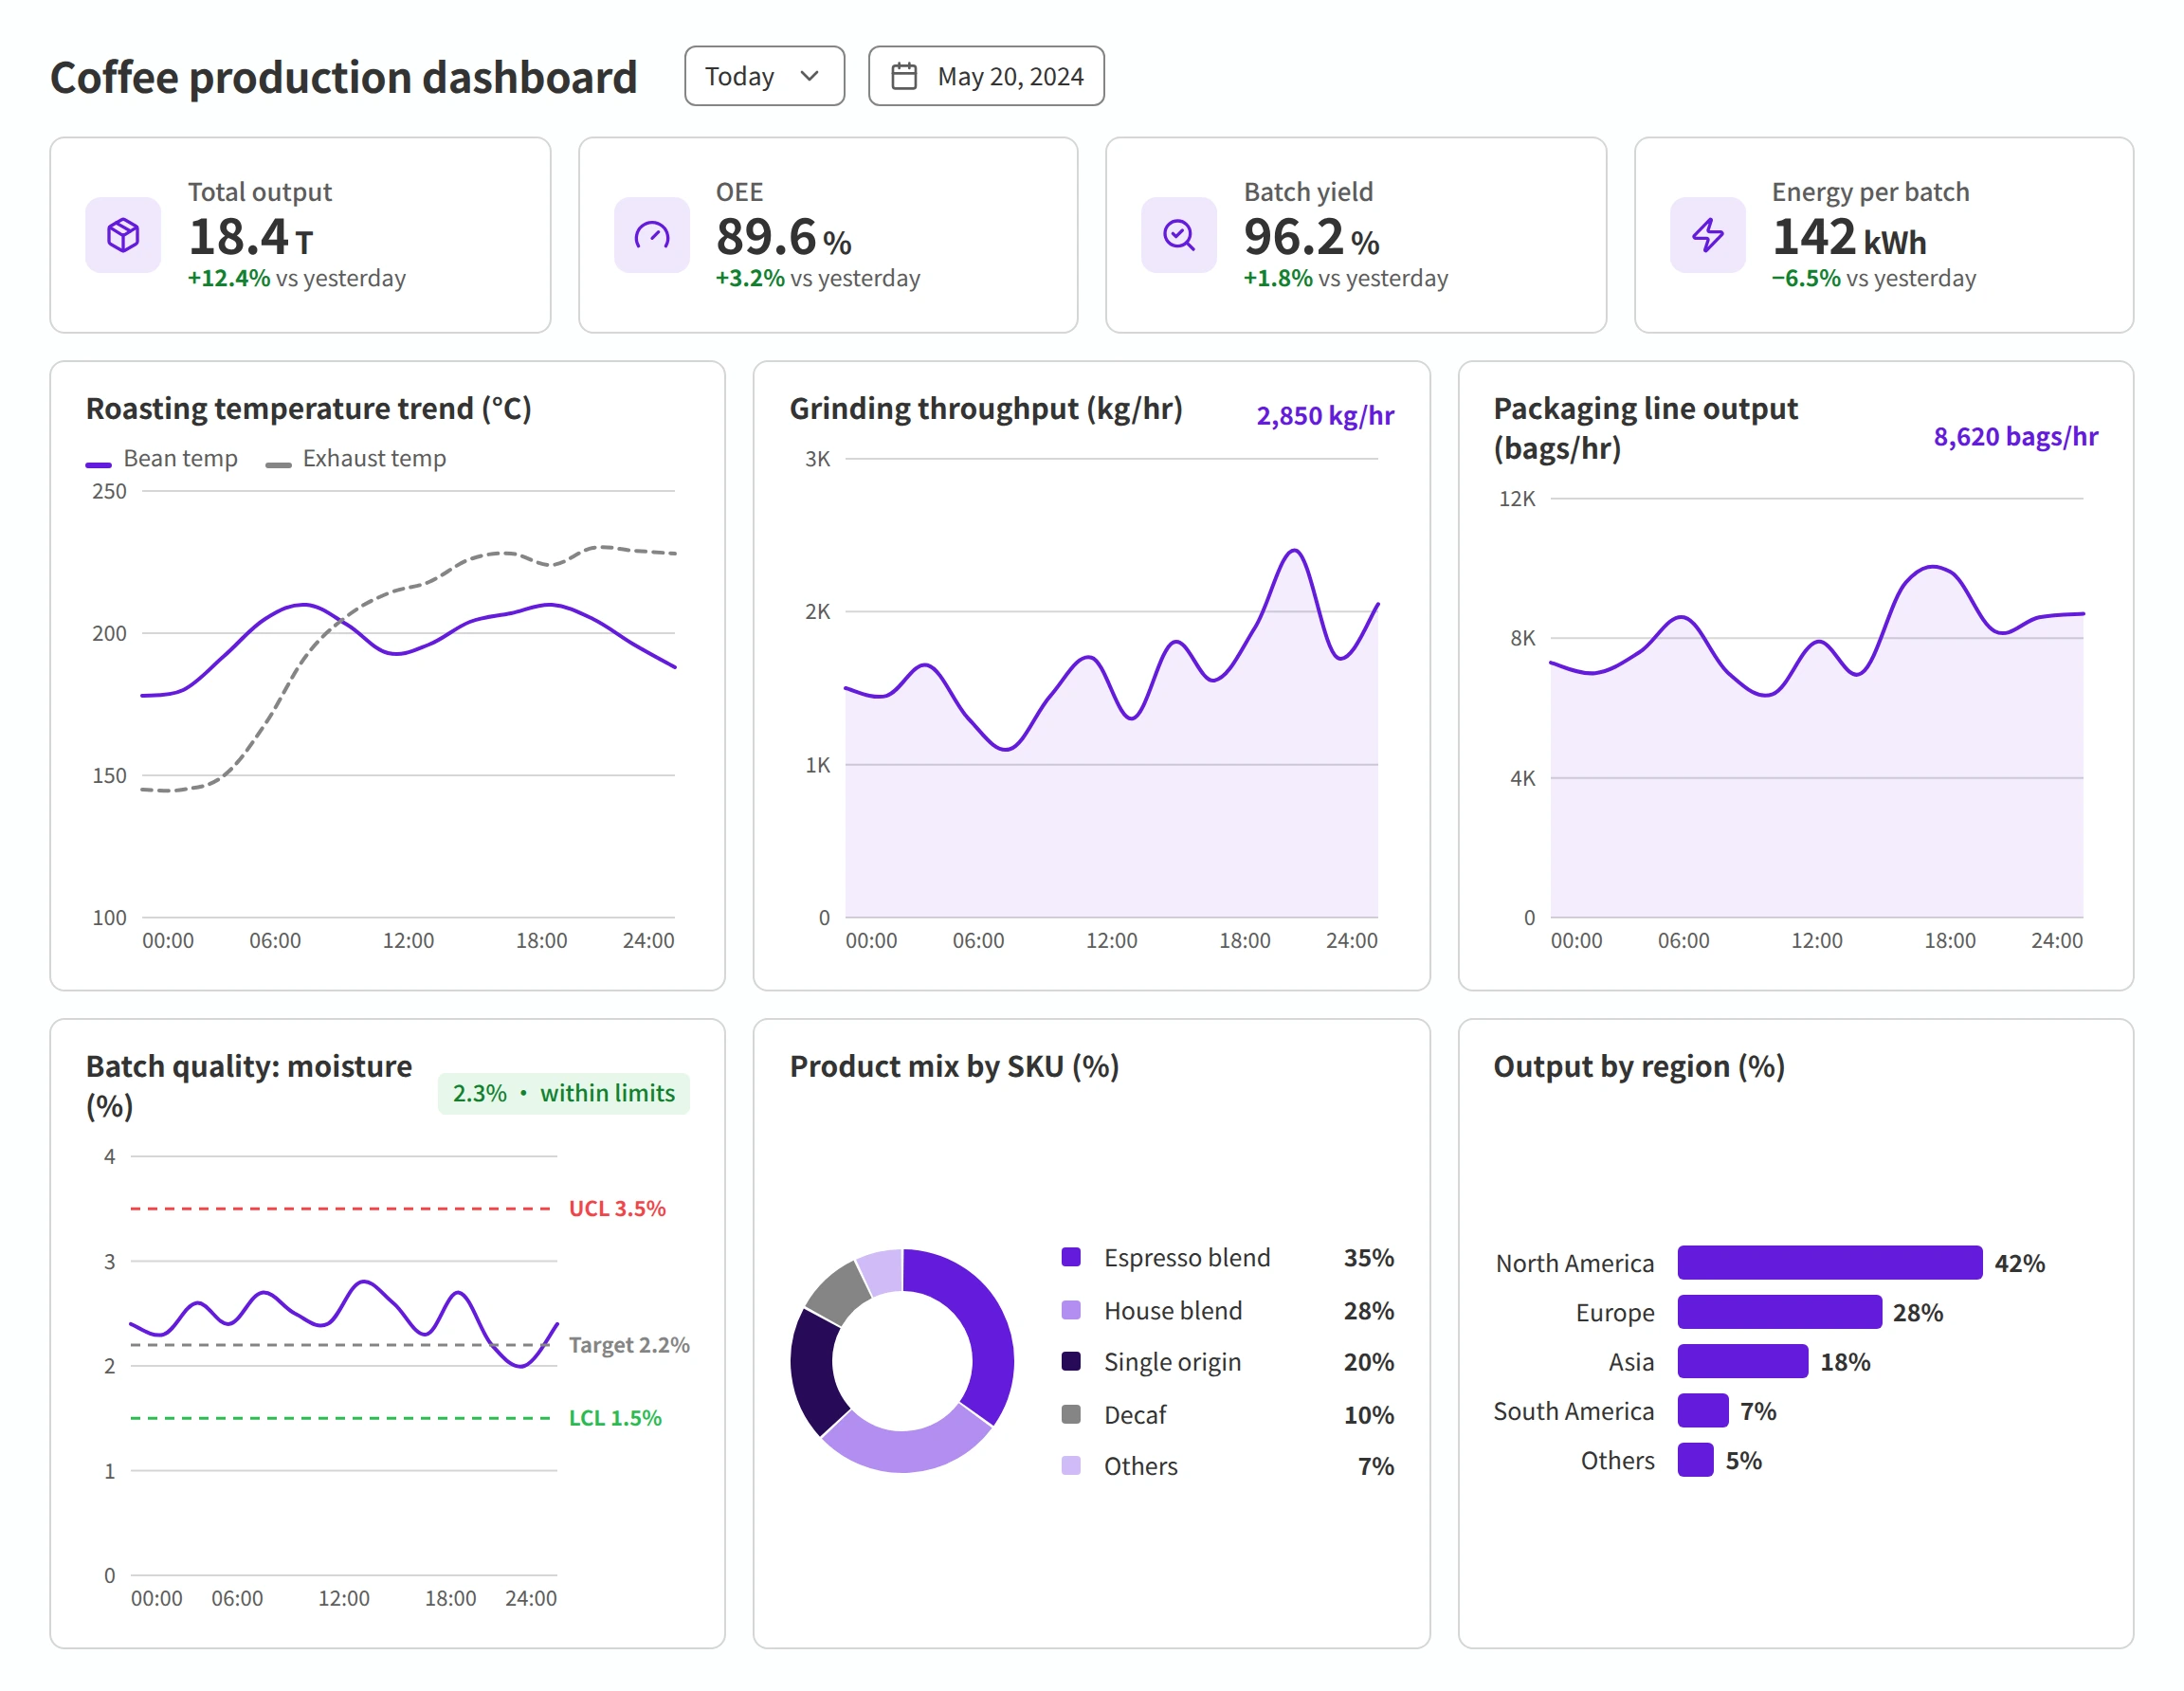
  • Coffee production dashboard: KPI cards for total output, OEE, batch yield and energy per batch, with roasting temperature, grinding throughput, packaging output, moisture control chart, product mix and regional output charts.Coffee production dashboard: KPI cards for total output, OEE, batch yield and energy per batch, with roasting temperature, grinding throughput, packaging output, moisture control chart, product mix and regional output charts.

    Dashboards, alarms & operational intelligence

    Coffee manufacturing dashboard & operational monitoring

    Context
    A coffee manufacturing plant: roasting, grinding, blending and packaging lines.
    My contribution
    Designed production, concept and operational monitoring dashboards.
    UX focus
    Three dashboards for three depths of investigation
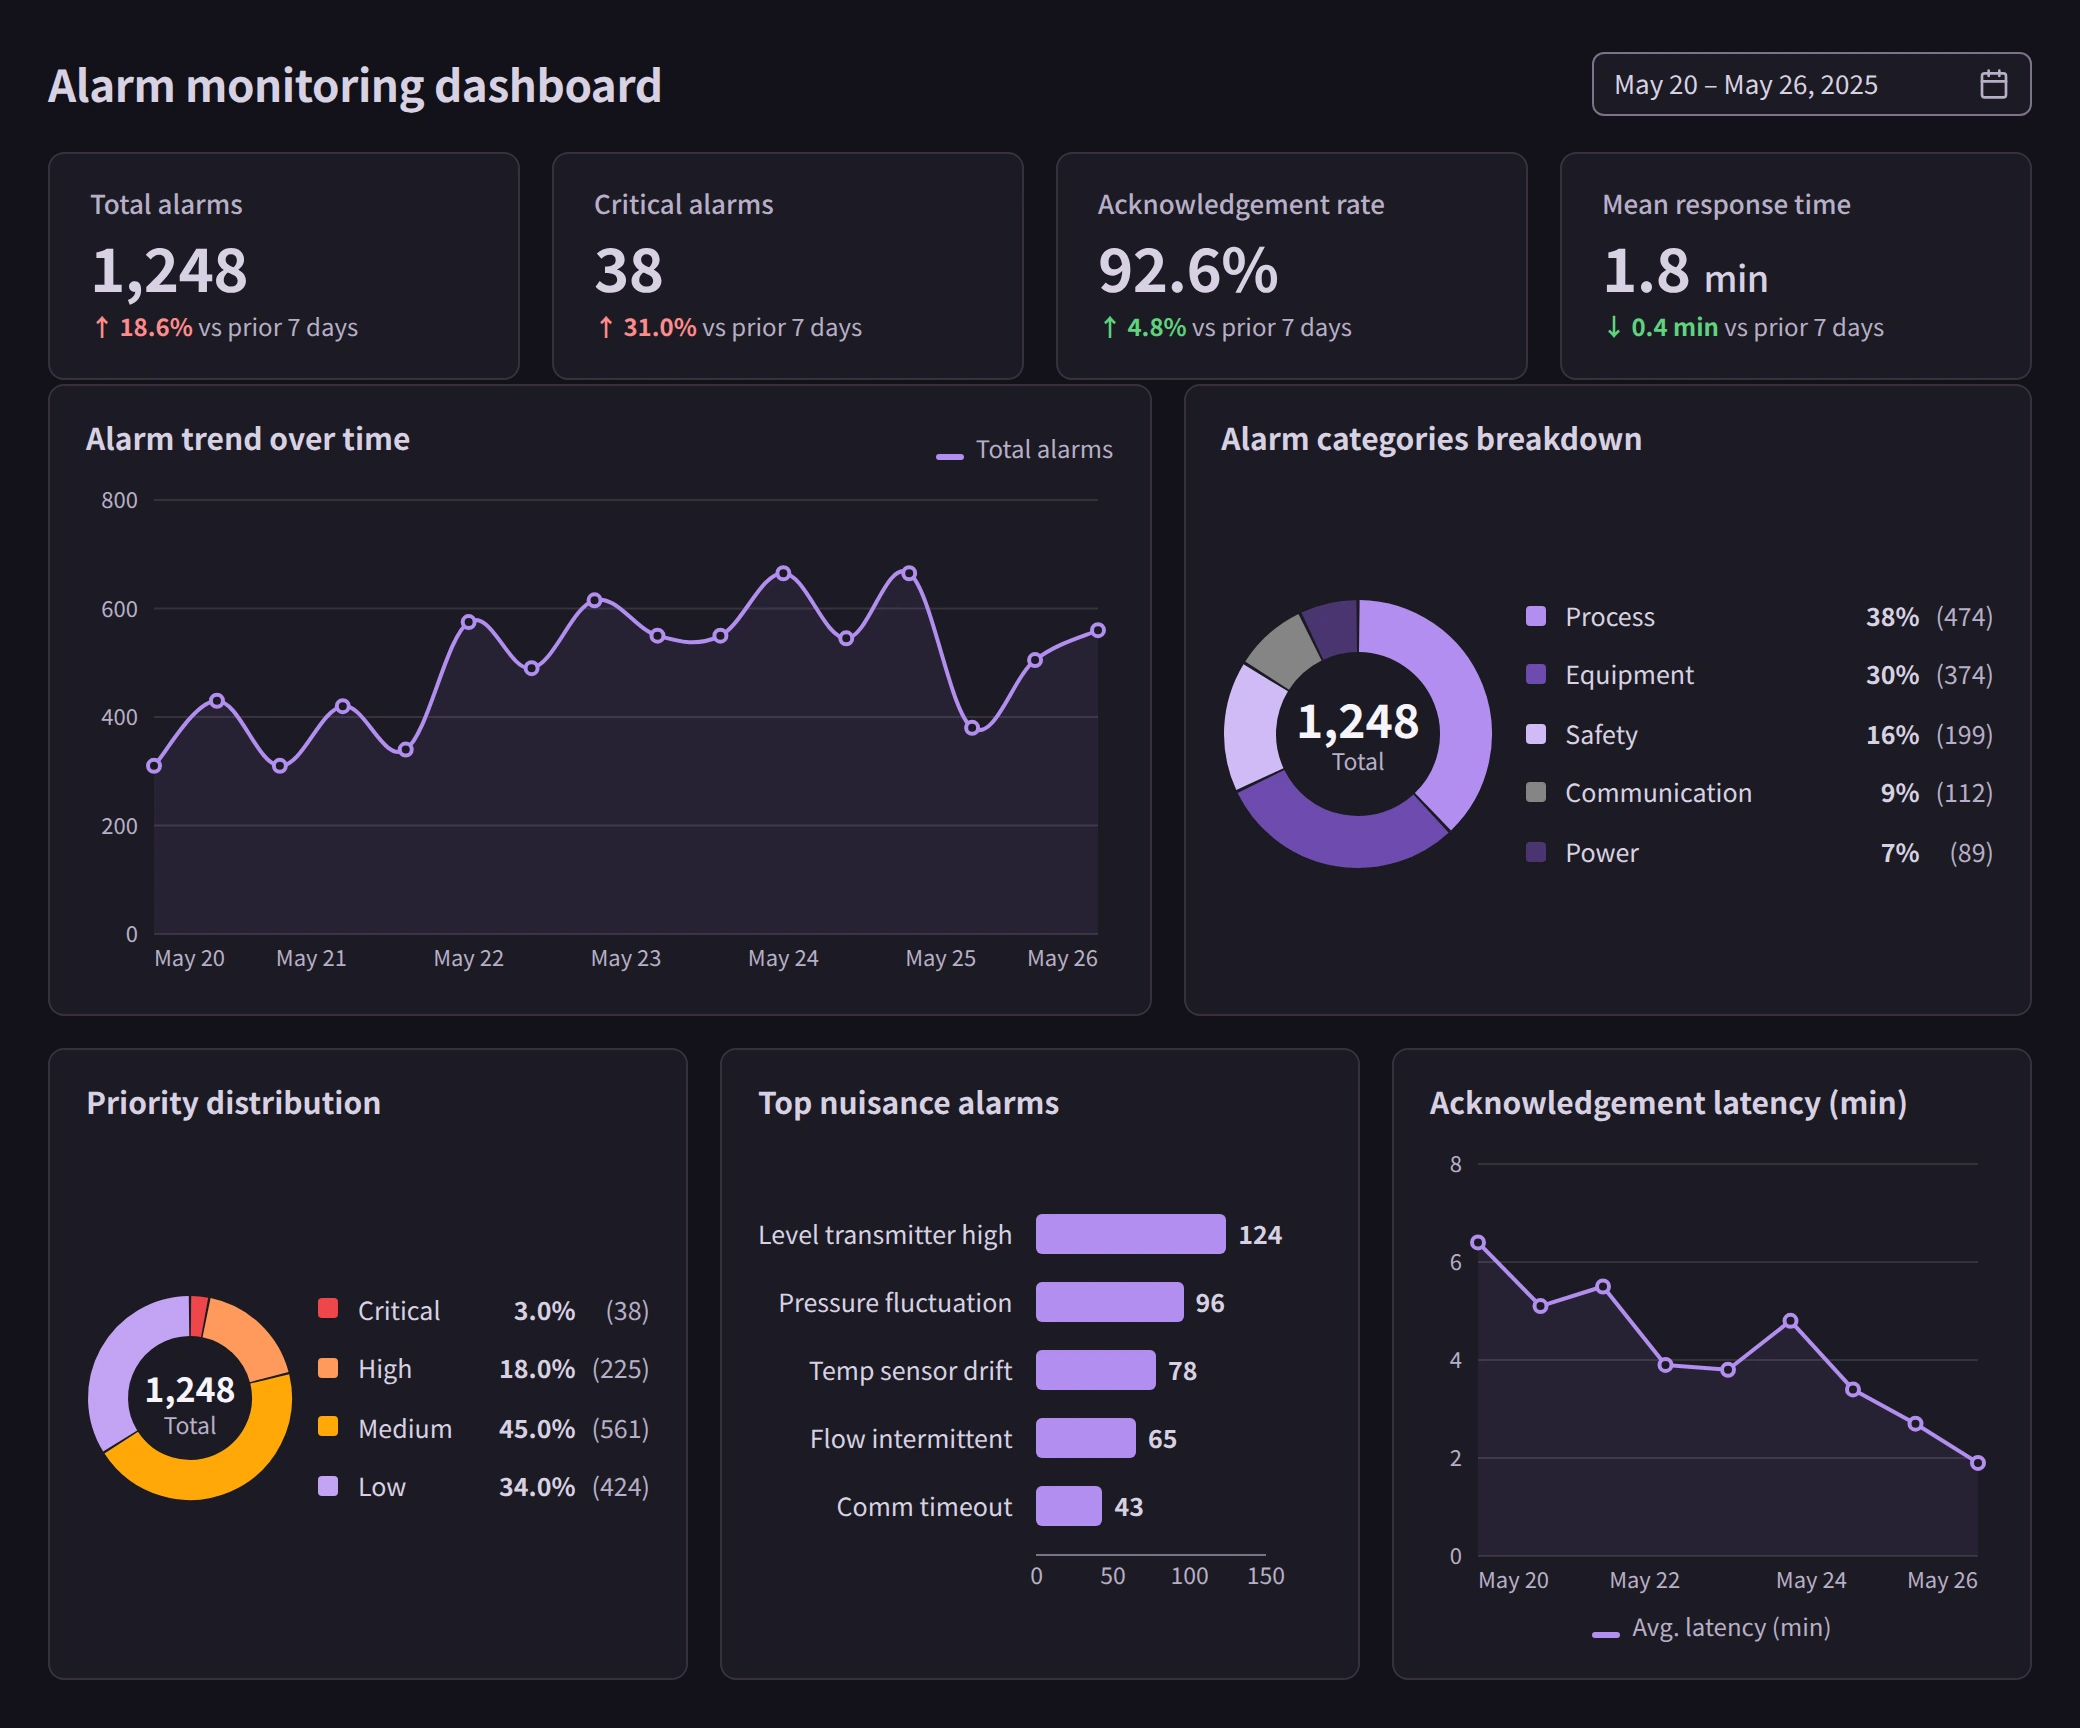
  • Alarm monitoring dashboard with KPI cards for total alarms, critical alarms, acknowledgement rate and mean response time, an alarm trend, category and priority donuts, top nuisance alarms and acknowledgement latency.Alarm monitoring dashboard with KPI cards for total alarms, critical alarms, acknowledgement rate and mean response time, an alarm trend, category and priority donuts, top nuisance alarms and acknowledgement latency.

    Dashboards, alarms & operational intelligence

    Alarm monitoring, anomaly detection & sequence timelines

    Context
    Alarm-heavy operations where event streams need to become prioritised, traceable work.
    My contribution
    Designed alarm categorisation, anomaly sequence and operations-centre views.
    UX focus
    From alarm summary, to event context, to the appropriate action
  • Proof-of-value & experience architecture

    Collaborative proof-of-value prototypes & demos

    Context
    Enterprise solution discussions where customers need to see a capability before committing to it.
    My contribution
    Designed clickable prototypes and scenario-driven demo flows with product, sales and solution architects.
    UX focus
    Translating customer goals into workflows people can click through
  • Industrial HMI, digital twins & asset visualization

    Industrial HMI experience systems

    Context
    Plant-floor operators interacting with complex machines through touch HMIs.
    My contribution
    Designed touch interactions, control patterns and screen structure; validated concepts with product, engineering and business.
    UX focus
    What must be visible now, what supports investigation, what needs confirmation
  • Industrial HMI, digital twins & asset visualization

    Digital twin HMI experience systems

    Context
    Operators and maintenance teams interpreting live equipment data through a digital representation of the asset.
    My contribution
    Designed monitoring screens, screen flows and system views; aligned them with engineering and domain teams.
    UX focus
    Connecting the physical asset, its digital twin and the operator's decision
  • Proof-of-value & experience architecture

    Pipeline network experience architecture

    Context
    Operators and stakeholders exploring critical pipeline infrastructure: valves, pumps, junction nodes and flow paths.
    My contribution
    Designed the experience architecture, user flows and a multi-layered network map.
    UX focus
    Making system relationships legible at network, subsystem and component level
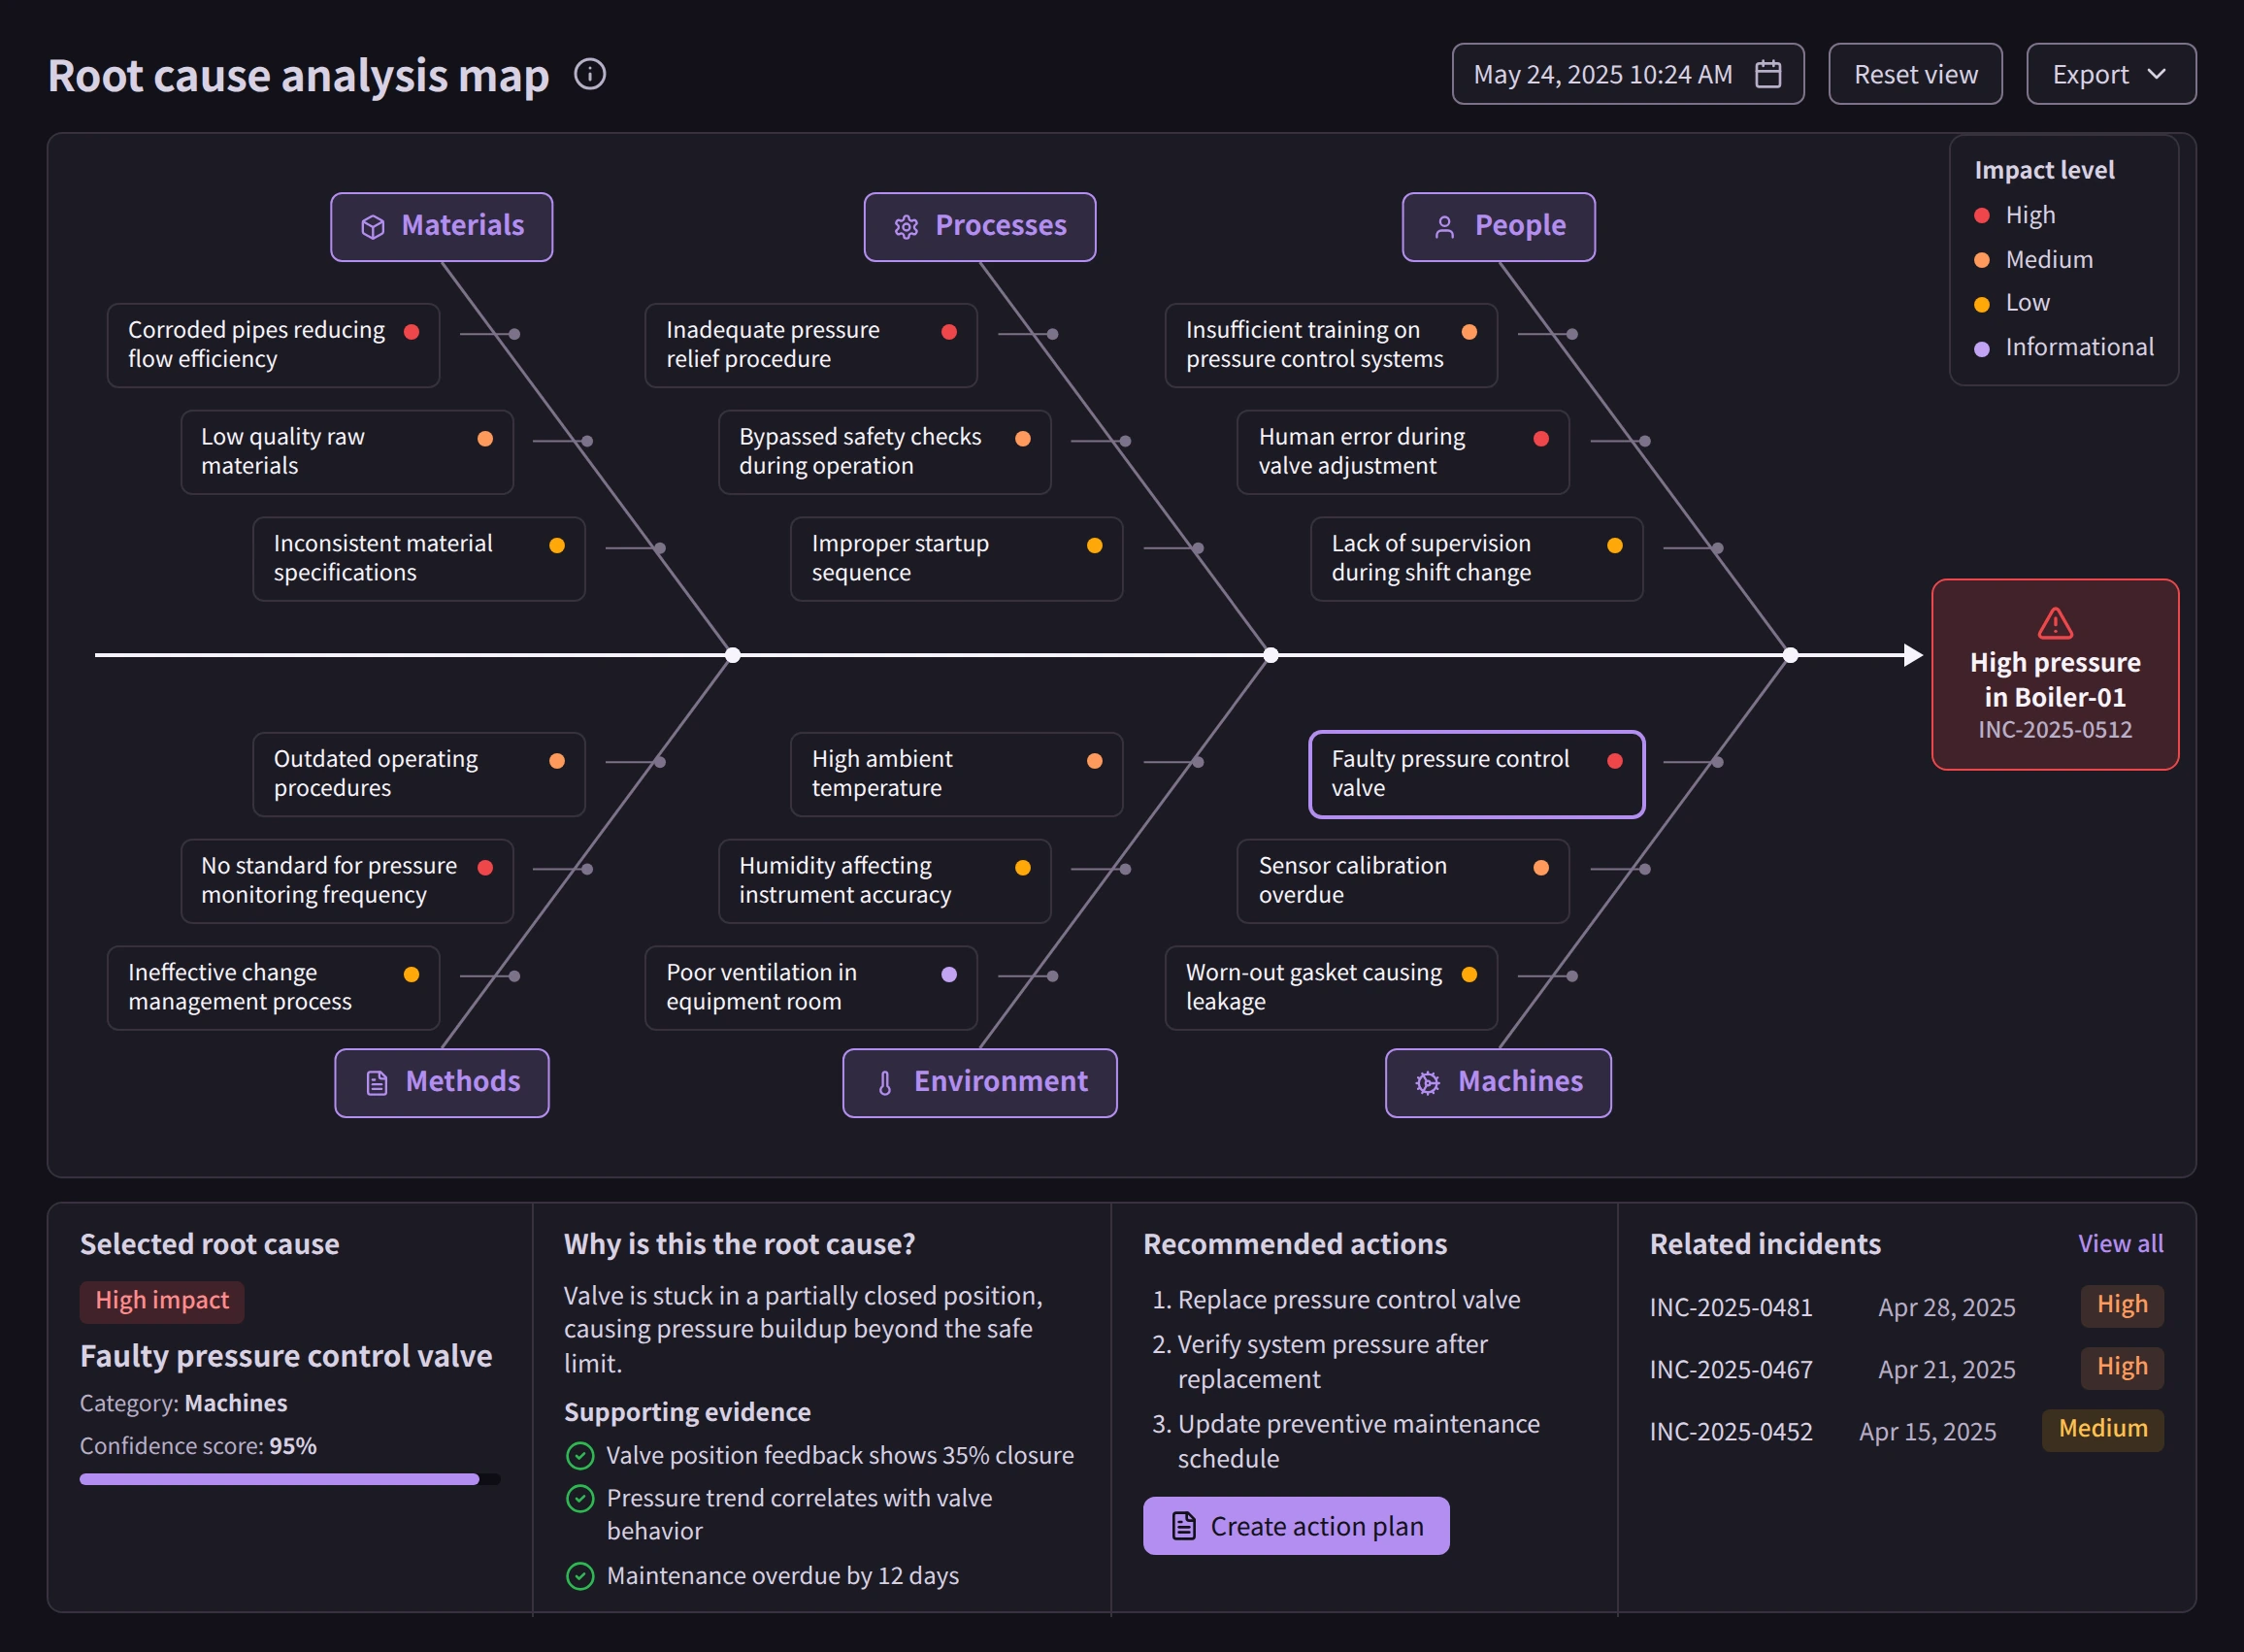
  • Root-cause analysis map: fishbone diagram with Materials, Processes, People, Methods, Environment and Machines categories leading to 'High pressure in Boiler-01', plus selected root cause, supporting evidence, recommended actions and related incidents.Root-cause analysis map: fishbone diagram with Materials, Processes, People, Methods, Environment and Machines categories leading to 'High pressure in Boiler-01', plus selected root cause, supporting evidence, recommended actions and related incidents.

    Diagnostics, root-cause analysis & information flow

    AI-assisted diagnostics & root-cause analysis

    Context
    Investigating a specific incident: high pressure in a boiler.
    My contribution
    Designed an interactive cause map with investigation flow, evidence and recommended actions.
    UX focus
    Exploring contributing factors and tracing them to a cause
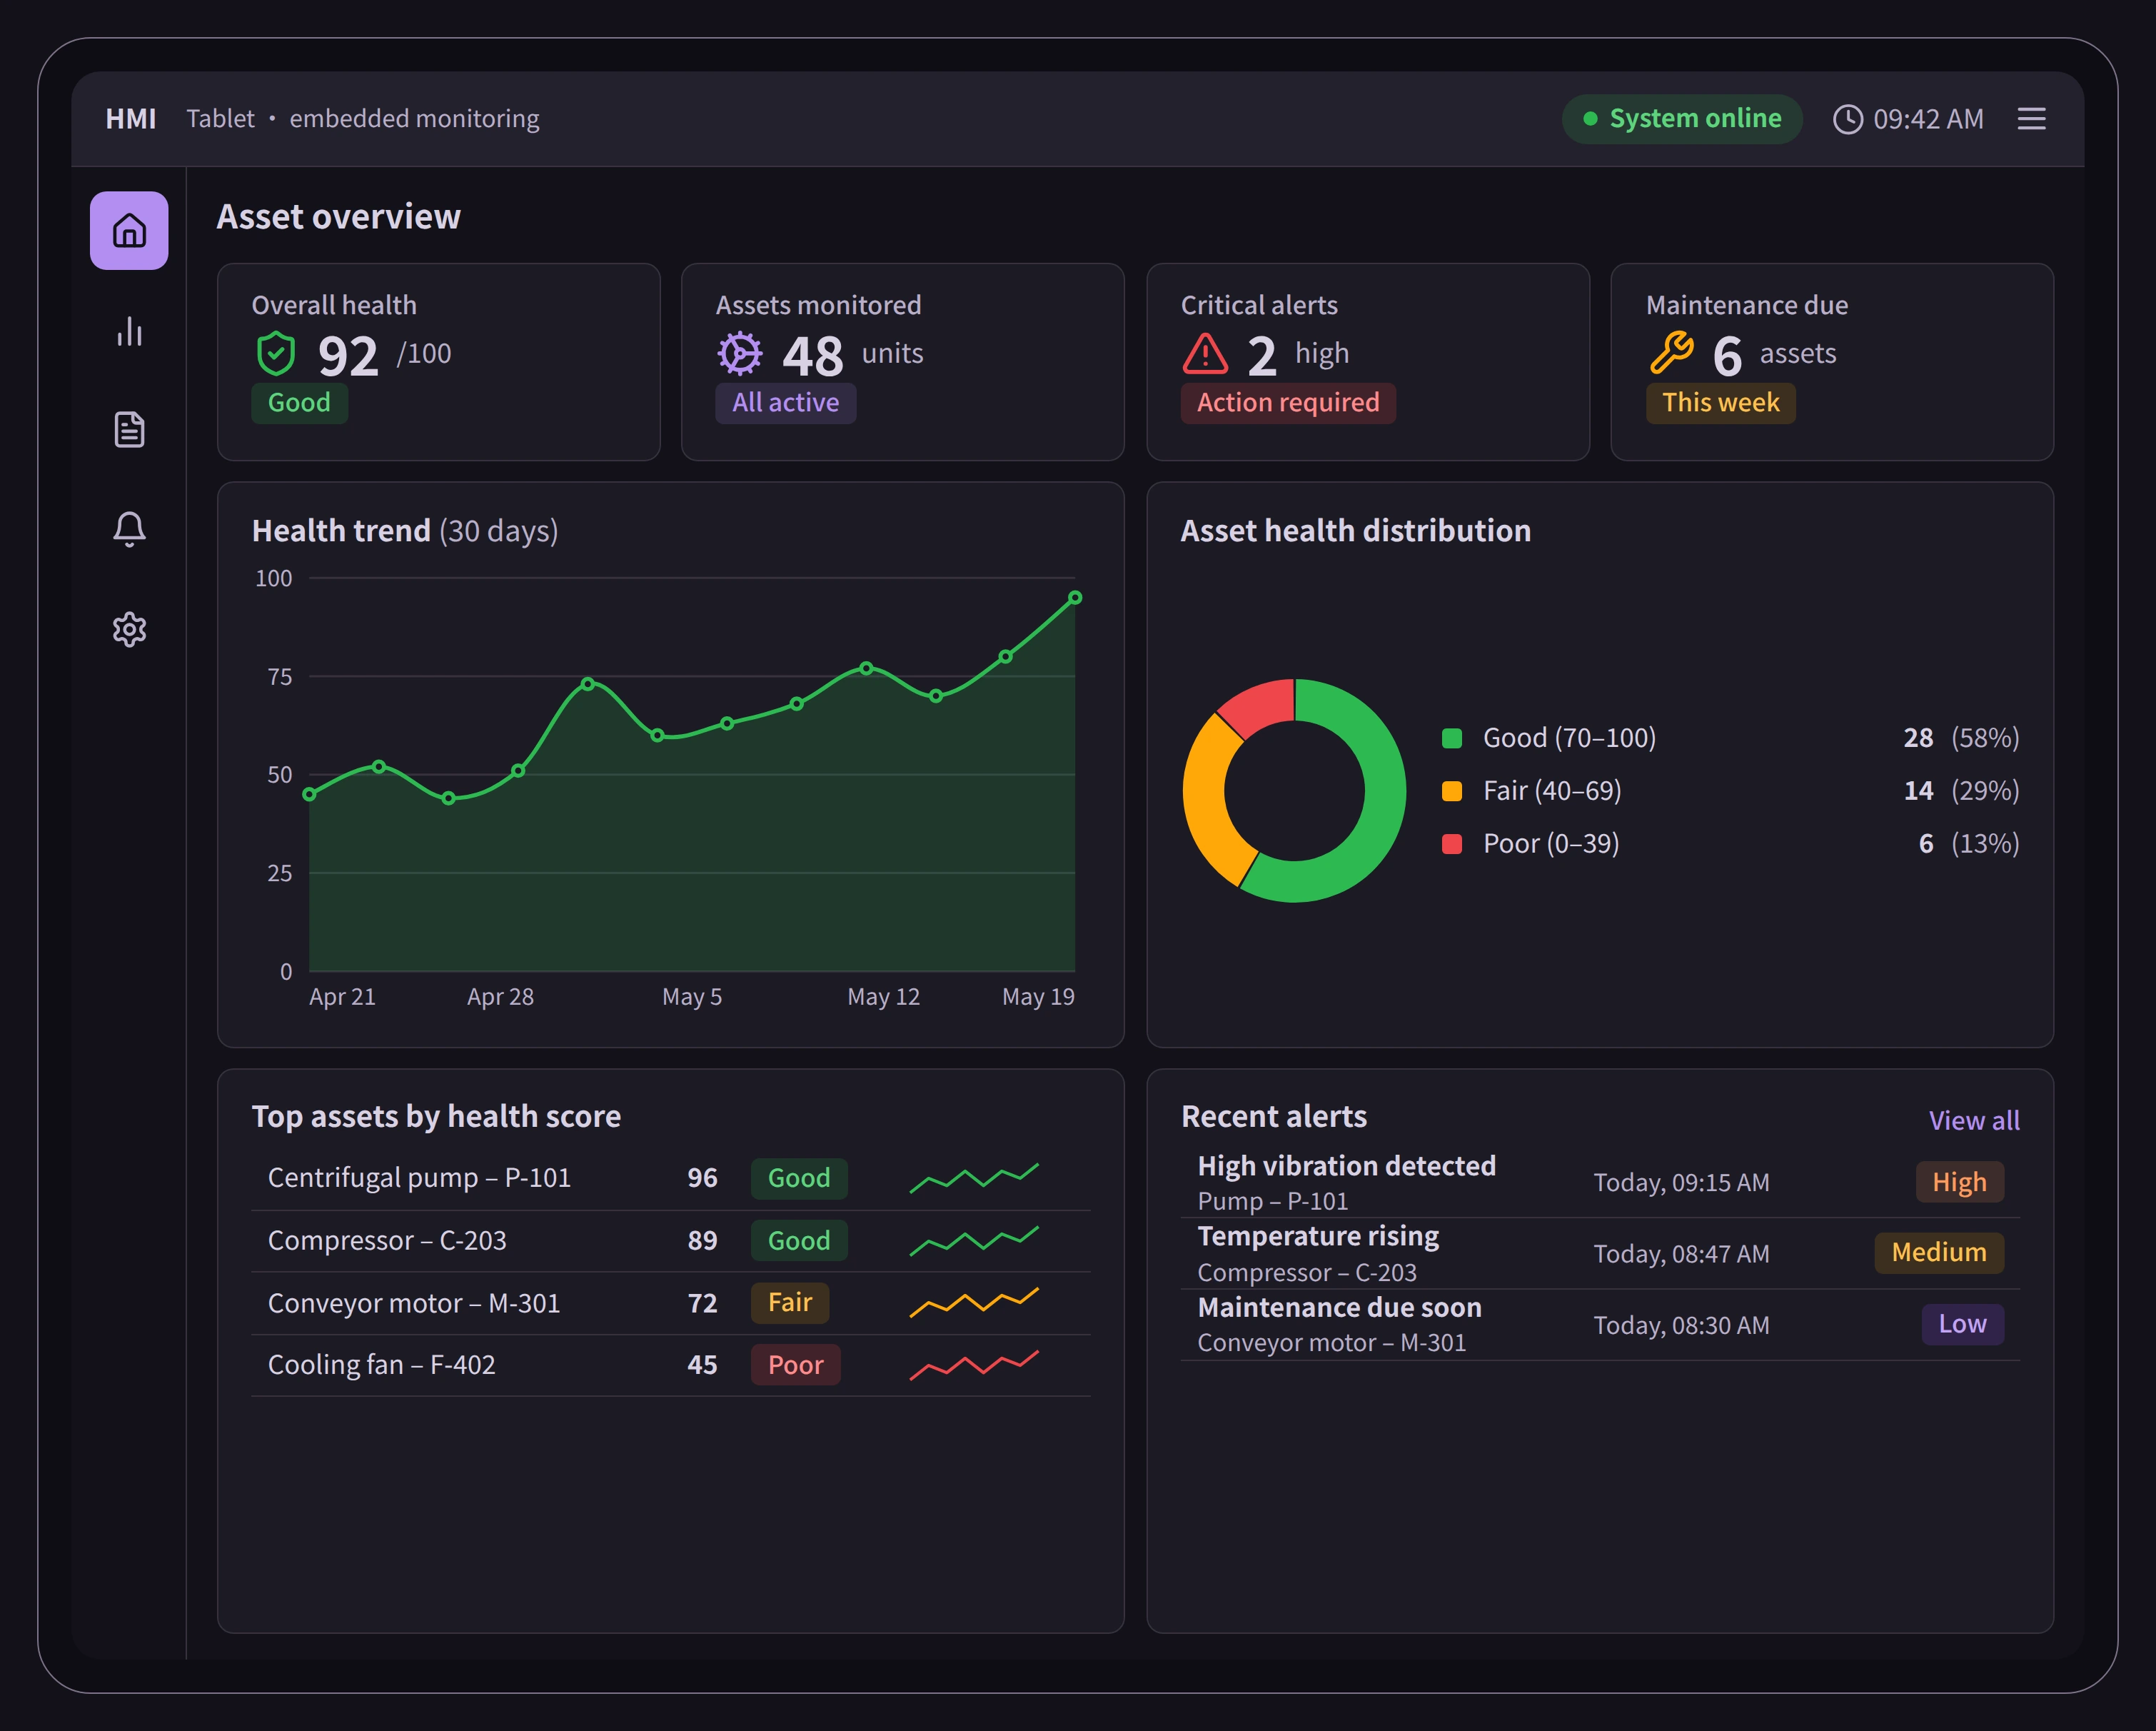
  • Dark HMI on a tablet: overall health, assets monitored, critical alerts and maintenance due tiles, health trend, health distribution, top assets by health score and recent alerts.Dark HMI on a tablet: overall health, assets monitored, critical alerts and maintenance due tiles, health trend, health distribution, top assets by health score and recent alerts.

    Asset health, maintenance & AI vision

    Asset health monitoring & predictive maintenance

    Context
    Embedded HMIs where operators track equipment condition and plan maintenance.
    My contribution
    Designed embedded monitoring interfaces for condition, early risk and maintenance priority.
    UX focus
    Health, risk and maintenance due, before failures affect operations
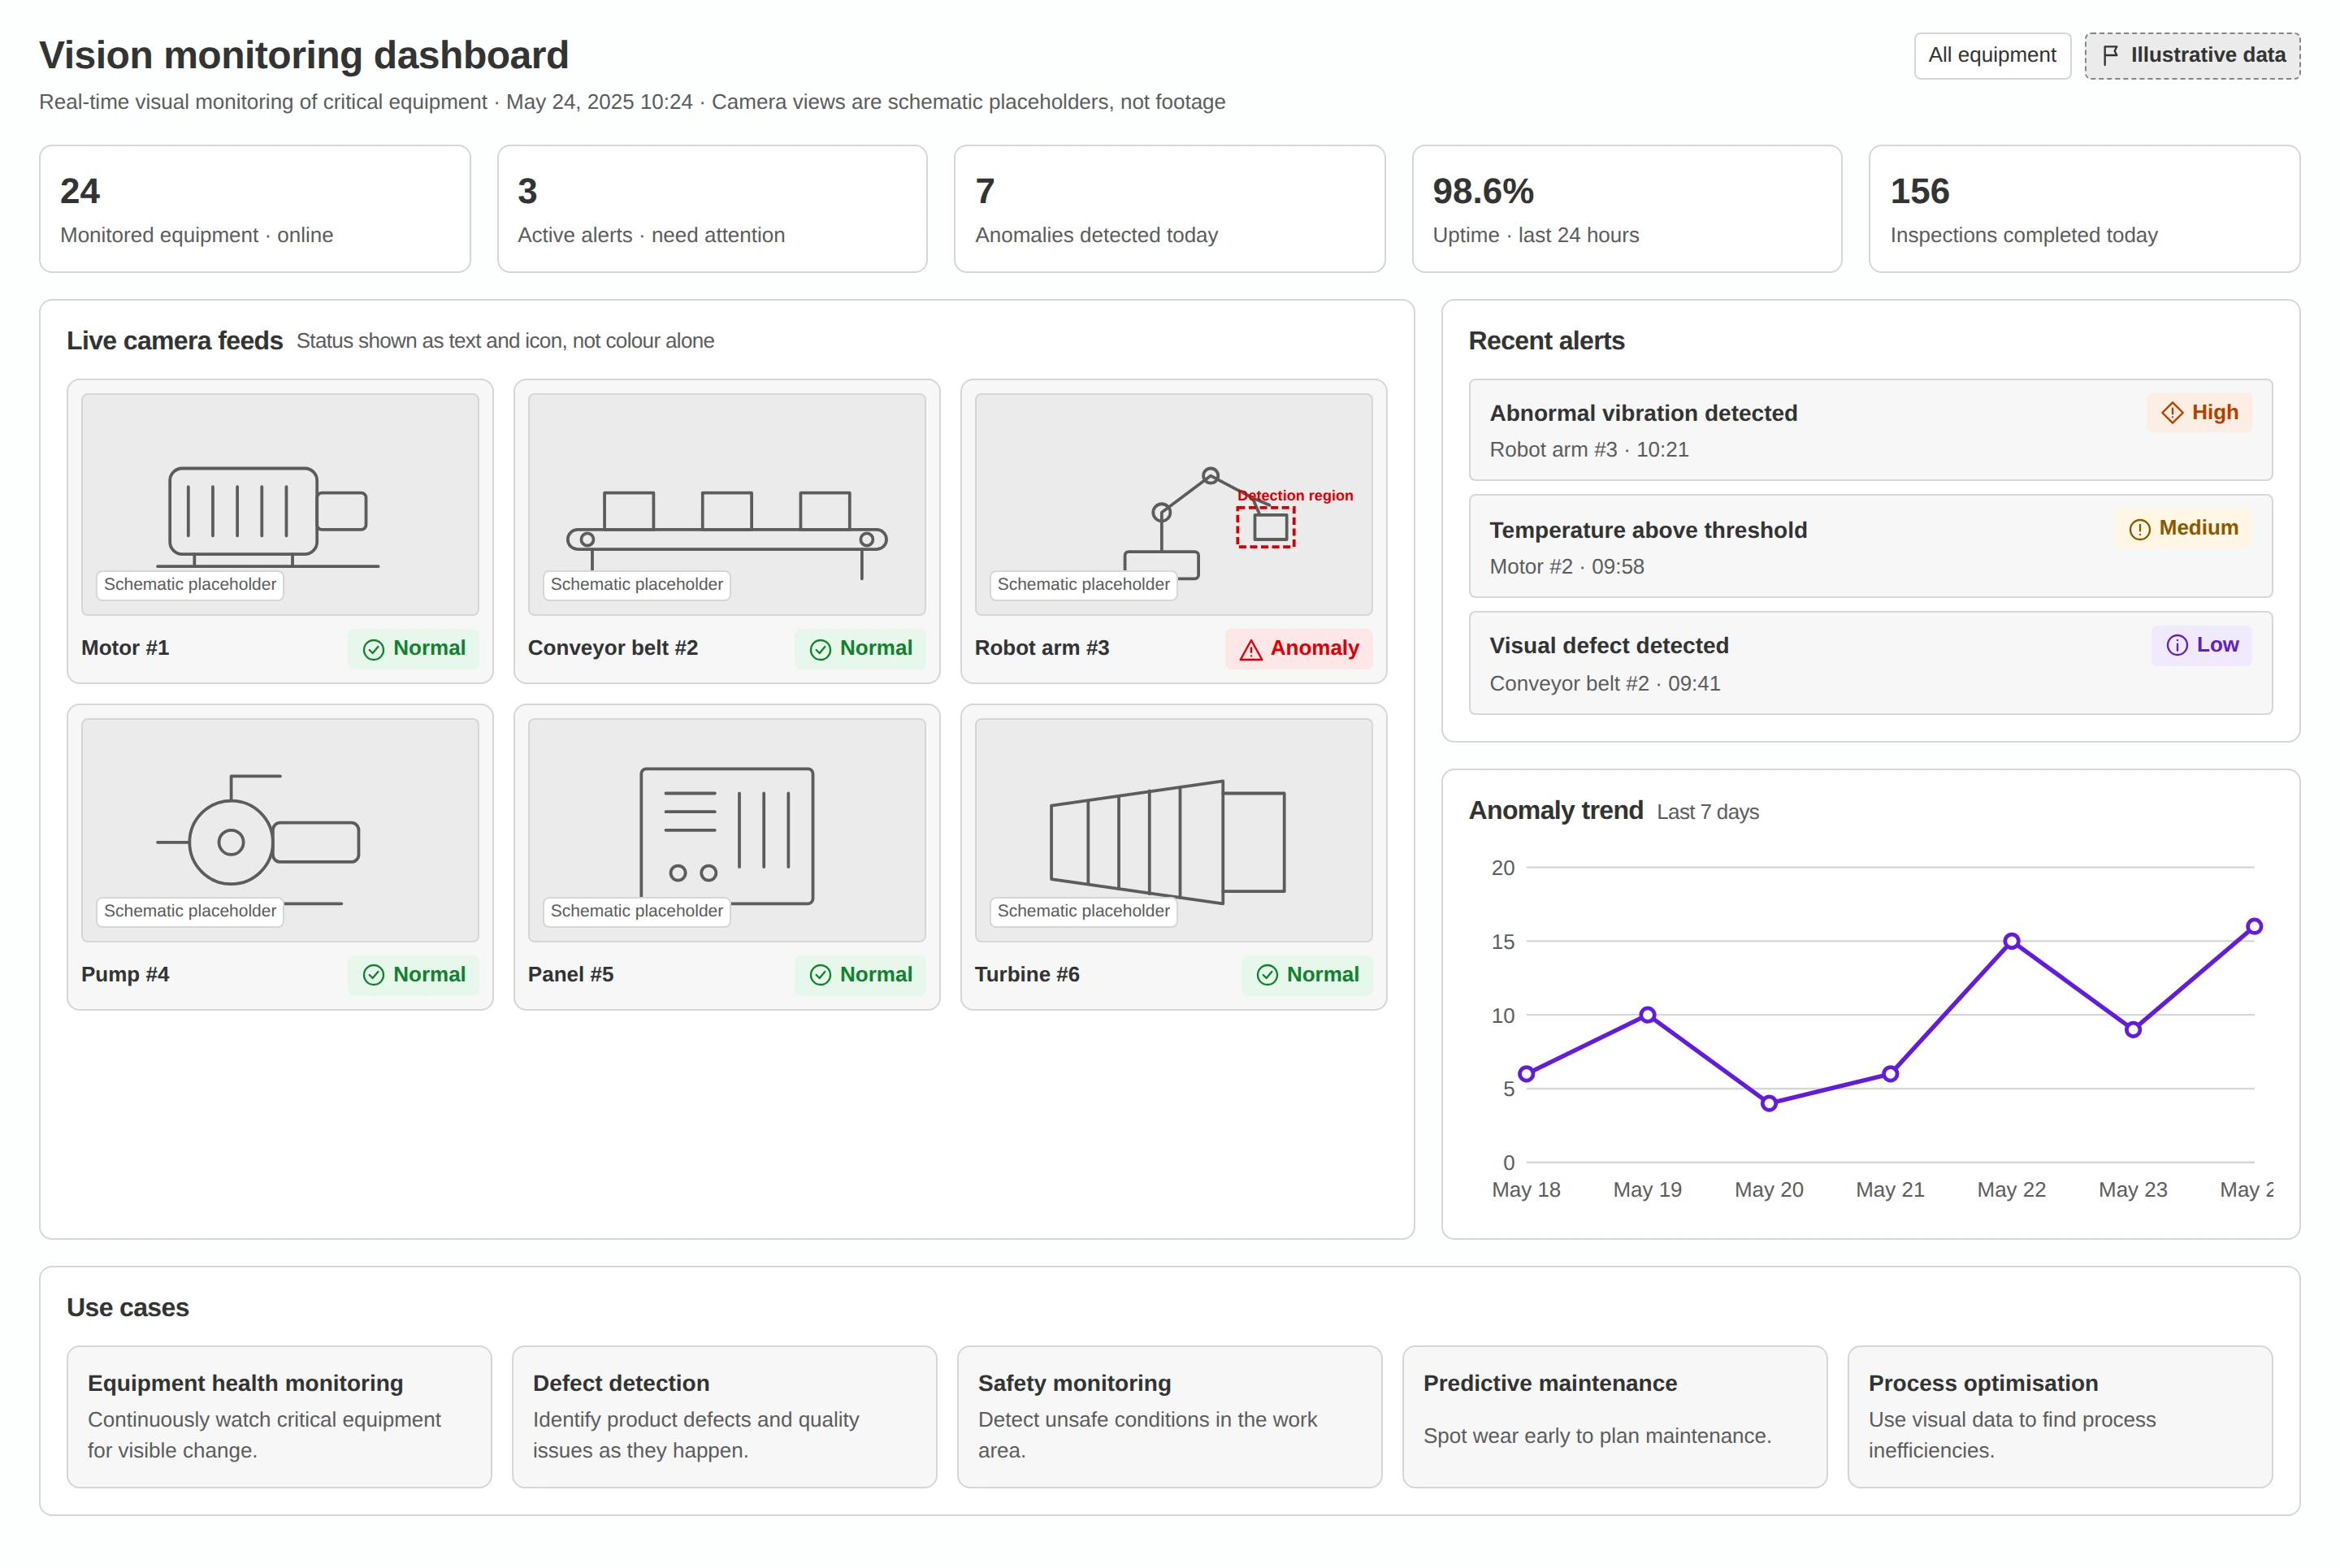
  • Reconstructed vision monitoring dashboard: five equipment KPIs, six schematic camera feeds with Normal or Anomaly status (Robot arm #3 flagged), three recent alerts with severity, a seven-day anomaly trend and five use cases.Reconstructed vision monitoring dashboard: five equipment KPIs, six schematic camera feeds with Normal or Anomaly status (Robot arm #3 flagged), three recent alerts with severity, a seven-day anomaly trend and five use cases.

    Asset health, maintenance & AI vision

    AI vision & real-time equipment monitoring

    Context
    Camera-based monitoring of motors, conveyors, robot arms, pumps and panels.
    My contribution
    Designed HMI interfaces for artificial-vision monitoring: live feeds, alerts and anomaly trends.
    UX focus
    Relating camera feeds to alerts, assets and trends

All case studies

27 case studies in five groups, each written to the same structure so they can be compared. Screens are representative and adapted for confidentiality; figures in them are illustrative.

Proof-of-value & experience architecture

Turning customer goals and complex infrastructure into concepts stakeholders can explore and discuss.

A1Enterprise UX · Concept prototypingSource: Part 001, p. 3

Collaborative proof-of-value prototypes & demos

Interactive, scenario-driven prototypes that let customers and internal stakeholders evaluate proposed product capabilities before they are built.

Flagship case studySource summary slide

  1. 1Customer context
  2. 2Workflow definition
  3. 3Concept design
  4. 4Interactive prototype
  5. 5Stakeholder review
Explanatory diagram of the delivery sequence described in the source. Not a project screen.
Context
Enterprise solution discussions where customers need to see a capability before committing to it.
My contribution
Designed clickable prototypes and scenario-driven demo flows with product, sales and solution architects.
Key UX focus
Translating customer goals into workflows people can click through
1 · Problem and why it mattered

Enterprise industrial-software conversations stalled at slideware; customers needed to see a capability working in their own scenario before committing to it.

2 · Users and operating context

Customer stakeholders evaluating a solution; internal sales, product and solution-architecture teams presenting it.

Enterprise industrial-software conversations often stall at slideware: buyers are asked to imagine how a capability would fit their operation. The source describes a body of work producing proof-of-value prototypes and demo experiences for these discussions, created with product, sales and solution-architecture teams.

3 · Evidence available at the start

The source summary slide describes the practice: cross-functional discovery, interactive prototype design, demo delivery and a stated count of 50+ prototypes. Individual prototypes, customers and outcomes are not included in the supplied material.

4 · Constraints, dependencies and confidentiality

Demos are customer-specific and confidential, so none is shown. Per the source, each had to be aligned, timely and customer-ready for a sales or solution conversation.

5 · My role and its boundaries

I contributed to 50+ proof-of-value prototypes and demo experiences, designing prototypes and concept flows and coordinating with product, sales and solution-architecture teams through concept, iteration and delivery. These were demonstrations for evaluation, not production releases.

The source credits me with designing the prototypes and concept flows and coordinating teams through concept, iteration and delivery. This is project and craft leadership; it does not establish line management of those teams. Separately, I have mentored two team members from a beginner level to working independently; that is mentoring, not direct-report management.

6 · Options and trade-offs
ChosenAlternative it rules outWhy
Scenario-driven flowsExhaustive feature toursA demo tells one coherent story tied to one customer goal.
Clickable prototypesStatic mock-upsStakeholders evaluate interaction, not just appearance.
Iteration with sales and solution architects before deliveryDesign-only preparationThe narrative stays within what is technically feasible.

The chosen options are documented in the source. The alternatives are the counter-options each decision rules out; the source does not record which alternatives were actually prototyped or tested.

7 · Key decisions and why
  • Scenario-driven flows instead of exhaustive feature tours, so a demo tells one coherent story.
  • Clickable prototypes rather than static mock-ups, so stakeholders can evaluate interaction, not just appearance.
  • Iteration with sales and solution teams before delivery, so the narrative matches what is technically feasible.

Each prototype was structured as a scenario: a customer goal, the workflow that serves it, and the screens a user would move through. The sequence below describes the delivery pattern documented in the source.

8 · Screen evidence
Source slide summarising the practice. Individual prototypes are not shown in the supplied material. Redesigned on the shared design system. Values are illustrative, as shown in the source; chart lines are approximate. Sample names and the platform logo are anonymised.
9 · Collaboration

Partnered with sales, product and solution-architecture teams to uncover customer needs, define use cases and shape demo narratives.

10 · Validation and review

Stakeholder review is part of the documented delivery pattern. The number of reviews, participants and the feedback received are not documented.

11 · Result

Commercial outcomes are not documented and are not claimed. The documented output is the body of work itself: 50+ proof-of-value prototypes and demo experiences that demonstrated product capabilities, communicated complex workflows and helped stakeholders evaluate proposed experiences. The exact period and per-project count are not yet established.

12 · Reflection and next step

The strongest improvement would be one anonymised prototype with its scenario, the decision it informed and what changed after review.

Back to all work

A2Experience architecture · InfrastructureSource: Part 001, p. 4

Pipeline network experience architecture

An information architecture and layered map that helps people navigate a complex pipeline network and understand how its parts relate.

Source summary slide

Three map layers: network overview, subsystem focus, contextual overlays for flow, pressure and maintenance Network overview Subsystem focus Flow · pressure · maintenance Contextual overlays
Explanatory diagram of the layered map structure described in the source. Not a project screen.
Context
Operators and stakeholders exploring critical pipeline infrastructure: valves, pumps, junction nodes and flow paths.
My contribution
Designed the experience architecture, user flows and a multi-layered network map.
Key UX focus
Making system relationships legible at network, subsystem and component level
Context

Pipeline networks combine many interdependent elements (valves, pumps, junction nodes, connections) whose states, flow, pressure and maintenance information matter together. Seeing one element in isolation rarely explains what is happening.

Design challenge

Let users move through a large, interconnected infrastructure without losing their place, while keeping status and operational context visible at the right level of detail.

Users & operational context

Operators and stakeholders responsible for monitoring and understanding the network. Detailed role definitions are not documented.

My role & scope

I designed the pipeline network experience architecture: the navigation paths, interaction flows and a multi-layered map.

UX objectives & principles
  • Reduce the cognitive effort of navigating a complex network (stated design objective).
  • Keep spatial relationships and flow paths understandable.
  • Surface status and maintenance information in context rather than in separate screens.
Information architecture & interaction approach

The map was organised in layers: a network overview, a subsystem focus, and contextual overlays for flow, pressure and maintenance insight. Navigation paths were structured so users could move between these levels deliberately.

Key interface decisions
  • Layered views so the overview stays readable and detail appears only when a user focuses on a subsystem.
  • Status-aware mapping so equipment state is visible on the map itself.
  • Context-aware navigation that keeps the user's position in the network clear while drilling down.
Visual evidence
Source slide. Map screens are not included in the supplied material. Redesigned on the shared design system. Values are illustrative, as shown in the source; chart lines are approximate. Sample names and the platform logo are anonymised.
Cross-functional considerations

Worked with customers and cross-functional teams to align the map design with operational needs, usability goals and implementation priorities.

Intended value

Intended to improve spatial understanding, operational visibility and task flow across the network. Usability-test results and navigation-speed measurements are not documented.

Next steps

Next step: add an anonymised map screen and a before/after of the navigation structure.

Back to all work

Industrial HMI, digital twins & asset visualization

Operator-facing screens and equipment representations that connect a physical asset to the decisions made about it.

B1HMI · Operator interactionSource: Part 001, p. 5

Industrial HMI experience systems

Operator-centred HMI patterns that make machine state clearer and critical tasks more direct.

Source summary slide

  1. Visible immediatelyEquipment state, active alarms, the value that changed
  2. Contextual detailTrends, history, related tags, needed during investigation
  3. Deliberate confirmationControl actions that change the machine's state
Explanatory diagram of the information hierarchy applied in this case study. Not a project screen.
Context
Plant-floor operators interacting with complex machines through touch HMIs.
My contribution
Designed touch interactions, control patterns and screen structure; validated concepts with product, engineering and business.
Key UX focus
What must be visible now, what supports investigation, what needs confirmation
Context

Industrial HMIs sit between an operator and equipment that can be expensive or unsafe to get wrong. Screens accumulate controls and readings over time, and operators work under time pressure.

Design challenge

Structure screens, alerts and workflows so operators can read equipment state quickly, find the right control, and complete critical tasks with confidence.

Users & operational context

Plant-floor operators. Shift patterns, environment and device specifics are not documented.

My role & scope

I designed touch interactions and control patterns, applied human-centred principles to the structure of screens, alerts and workflows, and worked with product, engineering and business teams to validate concepts and deliver HMI solutions.

UX objectives & principles
  • Reduce cognitive load (design objective; outcome not measured in the supplied material).
  • Make control visibility and system feedback unambiguous.
  • Support safer interactions through clear hierarchy and deliberate confirmation.
Information architecture & interaction approach

The diagram alongside describes the hierarchy this case study applies: information that must be visible immediately, contextual detail needed during investigation, and actions that require deliberate confirmation.

Key interface decisions
  • Context-aware controls: show the controls relevant to the current machine state instead of every control at once.
  • Usability-led screen architecture so navigation, visibility and task flow follow operator priorities.
  • Meaningful system feedback after every action, so the operator knows the machine responded.
Visual evidence
Source slide. Project HMI screens are not included in the supplied material. Redesigned on the shared design system. Values are illustrative, as shown in the source; chart lines are approximate. Sample names and the platform logo are anonymised.
Cross-functional considerations

Concepts were validated with product, engineering and business teams before delivery.

Intended value

Clearer, more confident operation of complex machines. Safety certification and measured cognitive-load reduction are not documented and are not claimed.

Next steps

Next step: add an anonymised HMI screen annotated with the three information tiers.

Back to all work

B2Digital twin · Real-time monitoringSource: Part 001, p. 7

Digital twin HMI experience systems

HMI screens that turn live operational data into decision-ready views of asset health, performance and anomalies.

Source summary slide

  1. 1Physical asset
  2. 2Digital representation
  3. 3KPIs, status & trends
  4. 4Operator decision
Explanatory diagram of how the interface connects asset, twin and decision. Not a project screen.
Context
Operators and maintenance teams interpreting live equipment data through a digital representation of the asset.
My contribution
Designed monitoring screens, screen flows and system views; aligned them with engineering and domain teams.
Key UX focus
Connecting the physical asset, its digital twin and the operator's decision
Context

A digital twin is only useful if the person looking at it can tell what the asset is doing and whether anything needs attention. Raw telemetry rarely answers that on its own.

Design challenge

Connect the equipment representation, its KPIs, status indicators and trends so that an operator can move from 'what is this asset doing?' to 'what should I do?' without hunting across screens.

Users & operational context

Operators and maintenance teams.

My role & scope

I designed HMI screens surfacing live equipment status, performance trends and anomaly signals, and structured the screen flows, alerts and system views.

UX objectives & principles
  • Make asset health and anomalies visible at a glance.
  • Reduce cognitive load and support faster task execution (design objectives).
  • Keep the digital representation tied to plant-floor decision workflows.
Information architecture & interaction approach

Context-aware screen architecture: the asset representation anchors the view; KPIs and status sit closest to it; trends and supporting detail follow. The pump-monitoring screen in B4 is a representative example of this structure.

Key interface decisions
  • Equipment visualisation as the primary navigation anchor rather than a list of tags.
  • Status and anomaly signals placed on or beside the asset they describe.
  • Trends separated from current values so 'now' and 'over time' are not confused.
Visual evidence
Source slide. See B3 and B4 for representative asset and monitoring visuals. Redesigned on the shared design system. Values are illustrative, as shown in the source; chart lines are approximate. Sample names and the platform logo are anonymised.
Cross-functional considerations

Collaborated with engineering, product and domain teams to align interfaces with plant-floor needs and decision workflows.

Intended value

Intended to help teams understand asset health, performance and anomalies with greater speed and confidence. Screens in this portfolio are representative; deployment status is not documented.

Back to all work

B3Asset visualization · Digital twin storytellingSource: Part 001, p. 8

Industrial asset visualization systems

Structured, reusable visual assets for turbines and process diagrams, each tuned to a different communication purpose.

Representative screensAdapted for confidentiality

Realistic visualization for product and training contexts. Redesigned on the shared design system. Values are illustrative, as shown in the source; chart lines are approximate. Sample names and the platform logo are anonymised.
Context
Equipment representations used in product, training and HMI contexts.
My contribution
Designed platform-style asset visuals for turbines and process-flow diagrams.
Key UX focus
Three levels of visual fidelity for three communication jobs
Context

Industrial software needs equipment imagery that is consistent across product screens, training material and sales storytelling. Ad-hoc renders drift in scale, angle and style.

Design challenge

Represent complex equipment clearly at different levels of technical detail, while keeping proportions, orientation and style consistent enough to reuse.

Users & operational context

Operators, trainees, product teams and customer audiences viewing equipment in HMIs and presentations.

My role & scope

I designed platform-style industrial asset visualizations: a steam turbine, a gas turbine and a process flow diagram (PFD) asset.

UX objectives & principles
  • Choose the level of realism that suits the job, rather than defaulting to maximum detail.
  • Keep consistent proportions and orientation so assets can be swapped and compared.
  • Support technical communication and digital-twin storytelling.
Information architecture & interaction approach

The three assets form a fidelity scale. A realistic render explains what a machine is; a semi-transparent technical view explains how it works inside; a simplified PFD explains how it fits into a process and where instruments sit.

Key interface decisions
  • Steam turbine: high-fidelity render for product and training contexts where recognisability matters.
  • Gas turbine: semi-transparent technical view for digital-twin and simulation storytelling, exposing internal stages.
  • PFD: simplified flow representation with instrument tags for system-level communication inside interfaces.
Visual evidence
Semi-transparent technical visualization for digital-twin storytelling. Redesigned on the shared design system. Values are illustrative, as shown in the source; chart lines are approximate. Sample names and the platform logo are anonymised.
Simplified process-flow representation for interface contexts. Redesigned on the shared design system. Values are illustrative, as shown in the source; chart lines are approximate. Sample names and the platform logo are anonymised.
Cross-functional considerations

Not documented for this project. Related asset standards are described in the design systems section.

Intended value

A reusable vocabulary of equipment visuals. These are visualization and UX assets, not evidence of engineering-model accuracy.

Back to all work

B4HMI · Equipment monitoringSource: Part 001, p. 9

Real-time data visualization: pump monitoring

An asset-level monitoring screen that integrates sensor readings and real-time feedback around a visual of the equipment.

Representative screensAdapted for confidentiality

Indicative screen; the source notes original images cannot be shared under the company's disclosure policy. Values are illustrative. Redesigned on the shared design system. Values are illustrative, as shown in the source; chart lines are approximate. Sample names and the platform logo are anonymised.
Context
Operators watching a pump's live condition from a control room.
My contribution
Developed screens that combine sensor data, live trends and alert status for a single asset.
Key UX focus
Equipment view, key metrics and trends in one readable hierarchy
Context

Operators monitoring a pump need its temperatures, pressures, speed and vibration in one place, alongside enough history to tell whether a reading is normal.

Design challenge

Combine a dense set of sensor parameters with trends and alerts without overwhelming the screen or hiding the asset itself.

Users & operational context

Control-room operators (the screen identifies an 'Operator, Control Room' user).

My role & scope

I developed screens that integrate sensor data and real-time feedback so operators can visualise equipment performance, detect anomalies and act proactively.

UX objectives & principles
  • Real-time visibility of critical parameters.
  • Early identification of deviations.
  • Proactive alerts before issues escalate.
  • Support for performance optimisation.
Information architecture & interaction approach

Tabbed asset navigation (overview, realtime data, trends, alarms, maintenance, history) keeps one pump's information in one place. The overview tab places a labelled equipment illustration at the centre, summary gauges to the right, an operating-parameters list with status bars beneath, and time-ranged trend charts at the bottom.

Key interface decisions
  • Callouts attached to the equipment image so each reading is tied to its physical location.
  • Operating parameters shown as value plus status bar, with timestamps, so currency of data is visible.
  • Trend charts with consistent time-range controls (1H to 1W, plus live) for speed and vibration-versus-speed.
Cross-functional considerations

Not documented for this project.

Intended value

A single, coherent view of one asset's condition. Displayed values are illustrative, not operating data.

Back to all work

Dashboards, alarms & operational intelligence

Monitoring, alarm and alert experiences that move people from a summary, to context, to the right action.

C1Dashboards · ManufacturingSource: Part 001, p. 10

Coffee manufacturing dashboard & operational monitoring

Dashboards that turn production, quality and equipment data into views for performance review and live plant observability.

Flagship case studyRepresentative screensAdapted for confidentiality

Production performance dashboard for fast review. Redesigned on the shared design system. Values are illustrative, as shown in the source; chart lines are approximate. Sample names and the platform logo are anonymised.
Context
A coffee manufacturing plant: roasting, grinding, blending and packaging lines.
My contribution
Designed production, concept and operational monitoring dashboards.
Key UX focus
Three dashboards for three depths of investigation
1 · Problem and why it mattered

Plant data from roasting, grinding, blending, packaging and quality checks was needed by different people at different depths; one dense screen would serve none of them well.

2 · Users and operating context

Production and operations teams. Specific roles are not documented.

A coffee plant generates data from roasting, grinding, blending and packaging, plus batch and quality checks. Different people need it at different depths: a production review, a process overview and a live operations view.

3 · Evidence available at the start

The source documents the plant stages, the KPIs and data types shown, and the three intended views. No user research, interviews or usage analytics are documented in the supplied source.

4 · Constraints, dependencies and confidentiality

Screens are adapted for confidentiality and use representative values. Data sources, integration constraints and the delivery platform are not documented in the supplied source.

5 · My role and its boundaries

I designed the dashboard and operational monitoring experiences for the plant.

The source credits me with the dashboard and monitoring experience design. Ownership of requirements, data integration and implementation is not documented.

6 · Options and trade-offs
ChosenAlternative it rules outWhy
Three views for three questions: review, process, liveOne combined dashboard for every audienceEach audience reads only the depth it needs. The cost is keeping three views consistent, handled through one visual language.
Current status separated from historical trendsStatus and trends mixed in one grid'Is anything wrong now?' can be answered without reading charts.
Control limits drawn on the moisture chartRaw moisture values onlyDeviation reads against target instead of relying on the reader to remember the limits.
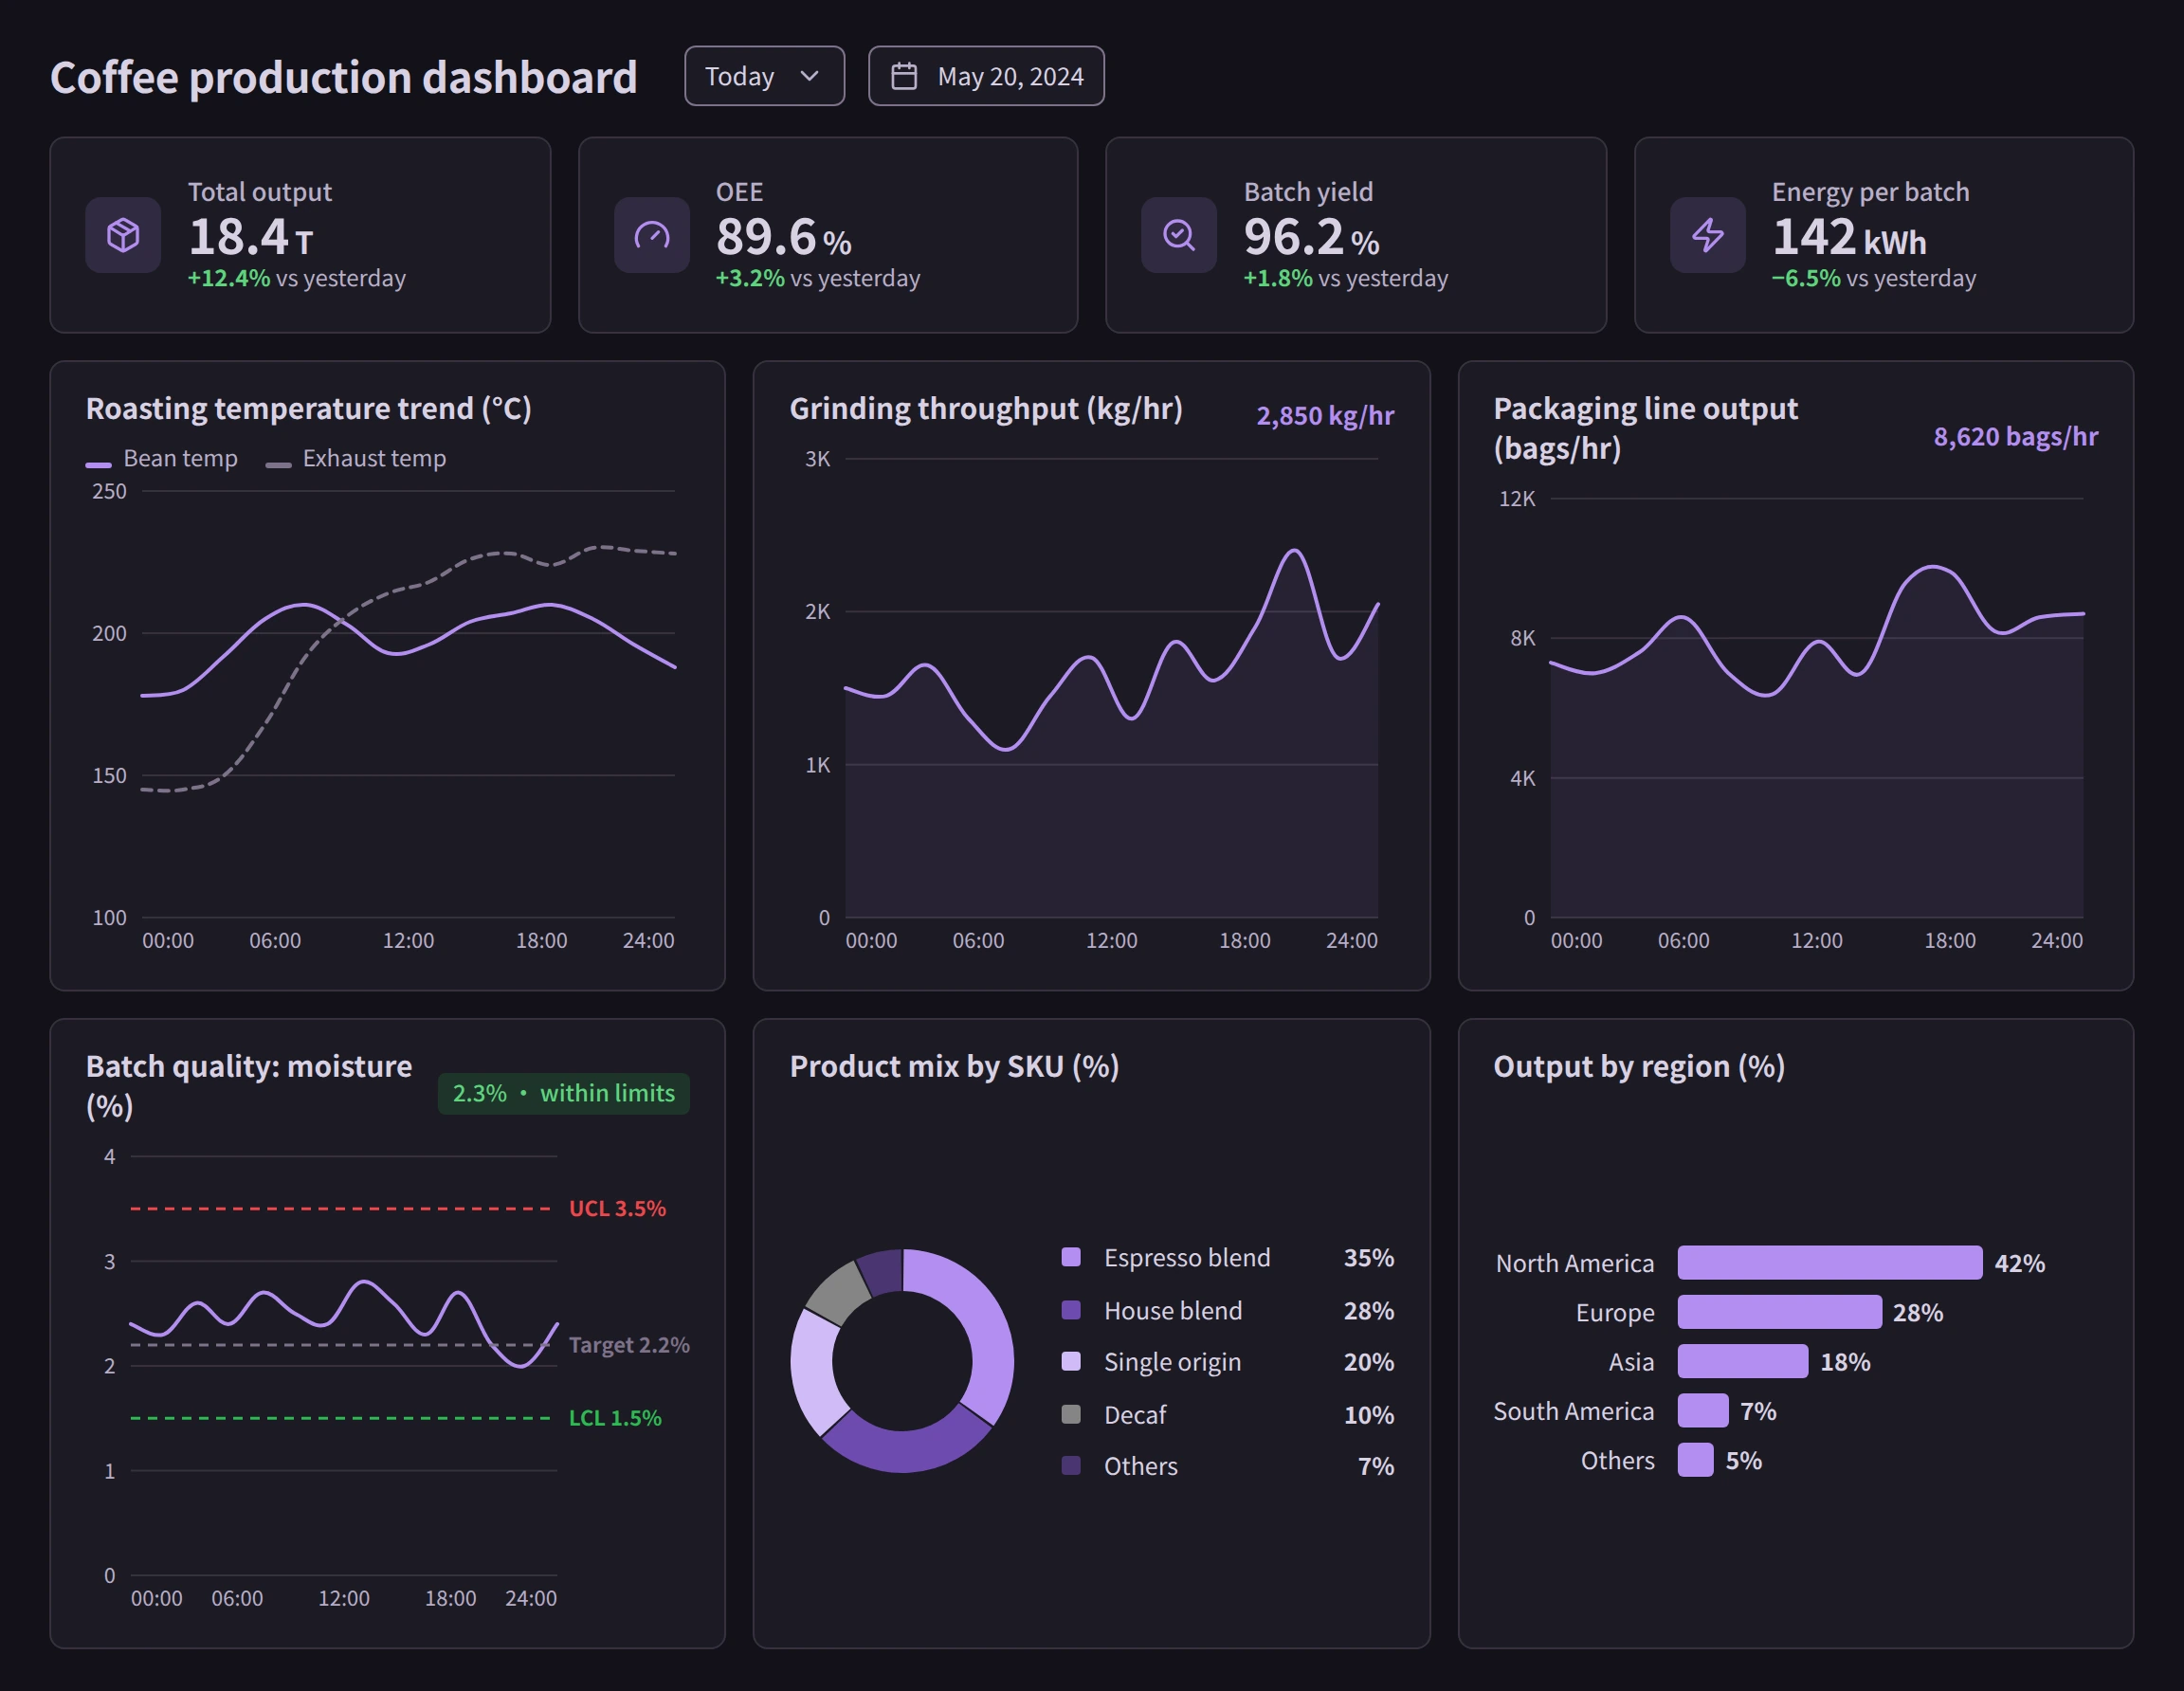
A dark treatment for the live operations viewOne light treatment for every viewDistinguishes continuous monitoring from periodic review. The cost is a second visual treatment of the same components.

The chosen options are documented in the source. The alternatives are the counter-options each decision rules out; the source does not record which alternatives were actually prototyped or tested.

7 · Key decisions and why
  • KPIs grouped at the top with comparison to the previous day, so change is visible without reading charts.
  • Current status (line status, equipment health, quality alerts) kept separate from historical trends.
  • Control limits drawn on the moisture chart so quality deviations read against target, not as raw numbers.
  • A dark operational view for continuous monitoring, distinct from the light review dashboard.

The three concepts map to levels of investigation. The production dashboard answers 'how did we do?'; the concept exploration organises the process stages spatially; the operational dashboard answers 'what is happening now, and is anything wrong?'

8 · Screen evidence
Early concept direction used to shape hierarchy and process visibility. Redesigned on the shared design system. Values are illustrative, as shown in the source; chart lines are approximate. Sample names and the platform logo are anonymised.
Illustrative prototype: some sample values on this screen do not reconcile and are not validated results. Operational monitoring dashboard for live observability. Redesigned on the shared design system. Values are illustrative, as shown in the source; chart lines are approximate. Sample names and the platform logo are anonymised.
9 · Collaboration

Not documented for this project.

10 · Validation and review

Not documented in the supplied source.

11 · Result

No measured outcome is documented. Intended outcome: faster production review and earlier visibility of line or quality issues. A measurement plan would compare the time to answer common review questions, and the time from a quality deviation to its acknowledgement, before and after rollout.

12 · Reflection and next step

Evidence is the gap in this case. The next step is to add any review feedback that exists and to show one end-to-end path from a KPI change in the review view to the live view that explains it.

Back to all work

C2Alarms · Event sequencingSource: Part 001, p. 11

Alarm monitoring dashboard & anomaly timelines

A connected set of alarm views covering categorisation, anomaly sequence and live operations, designed to make event streams decision-ready.

Flagship case studyRepresentative screensAdapted for confidentiality

Alarm categorisation dashboard for review. Redesigned on the shared design system. Values are illustrative, as shown in the source; chart lines are approximate. Sample names and the platform logo are anonymised.
Context
Alarm-heavy operations where event streams need to become prioritised, traceable work.
My contribution
Designed alarm categorisation, anomaly sequence and operations-centre views.
Key UX focus
From alarm summary, to event context, to the appropriate action
1 · Problem and why it mattered

Alarm systems produce more events than people can read as a list; operators needed to move from a summary, to the context of one event, to the right action.

2 · Users and operating context

Operations teams and alarm handlers.

Alarm systems produce high volumes of events. Without structure, operators see a list; they need categories, priorities, acknowledgement state and the order in which things happened.

3 · Evidence available at the start

The source documents the three views and their intent. No alarm-rate data, operator research or feedback is documented in the supplied source.

4 · Constraints, dependencies and confidentiality

Screens are adapted for confidentiality and use illustrative values. Integration with the alarm system, the alarm philosophy and the approval process are not documented.

5 · My role and its boundaries

I designed the dashboard and operational monitoring experiences, focusing on alarm categorisation, anomaly sequence timelines, priority management, acknowledgement tracking and real-time observability.

The source credits me with the dashboard and monitoring experience design for these three views. The related swim-lane timeline (C3) is presented in the source as a generic representation; my scope on that screen awaits confirmation.

6 · Options and trade-offs
ChosenAlternative it rules outWhy
Category and priority breakdowns beside the trendTrend first, breakdowns on a second page'How many' and 'which kind' are read together.
A 'top nuisance alarms' viewTotals by severity onlyMakes the sources of alarm floods visible so they can be addressed.
A severity-by-hour heatmap in the operations viewA single severity totalReveals time-of-day patterns that a total hides.
Acknowledgement latency and status shown explicitlyAcknowledgement implied by colourResponse performance becomes visible and is not carried by colour alone.

The chosen options are documented in the source. The alternatives are the counter-options each decision rules out; the source does not record which alternatives were actually prototyped or tested.

7 · Key decisions and why
  • Category and priority breakdowns placed beside trends, so 'how many' and 'which kind' are read together.
  • A 'top nuisance alarms' view to make alarm-flood sources visible.
  • A severity-by-hour heatmap in the operations view for spotting time-of-day patterns.
  • Acknowledgement latency and status shown explicitly rather than implied.

Three linked views: a categorisation dashboard for review; an anomaly sequence concept that traces an incident through clustered and correlated events to a root-cause hint and severity score; and an operations centre for live alarm queue, heatmaps and zone health.

8 · Screen evidence
Illustrative prototype: some sample values on this screen do not reconcile and are not validated results. Anomaly sequence concept tracing an incident's progression. Redesigned on the shared design system. Values are illustrative, as shown in the source; chart lines are approximate. Sample names and the platform logo are anonymised.
Illustrative prototype: some sample values on this screen do not reconcile and are not validated results. Live operational monitoring view. Redesigned on the shared design system. Values are illustrative, as shown in the source; chart lines are approximate. Sample names and the platform logo are anonymised.
9 · Collaboration

Not documented for this project.

10 · Validation and review

Not documented in the supplied source.

11 · Result

No measured outcome is documented; response time, acknowledgement rate and other values on the screens are illustrative. A measurement plan would track alarms per operator per hour, the share of nuisance alarms, and acknowledgement latency, before and after.

12 · Reflection and next step

The anomaly sequence concept shows a 'high confidence' root-cause hint. A production version needs a validated basis for any confidence wording, or should present the hint as a suggestion with its evidence, as the reconstructed D3 screen does.

Back to all work

C3Alarms · Sequence timelinesSource: Part 001, p. 12

Anomaly timeline & event sequencing

A swim-lane anomaly timeline that shows how events cascade across systems, with filtering and a focused event sequence.

Representative screensAdapted for confidentiality

Illustrative prototype: some sample values on this screen do not reconcile and are not validated results. Generic representation per the source note; values are illustrative. Redesigned on the shared design system. Values are illustrative, as shown in the source; chart lines are approximate. Sample names and the platform logo are anonymised.
Context
Operators following anomalies as they spread across power, cooling, conveyor and boiler systems.
My contribution
Designed a swim-lane timeline with filtering, grouping and selected-event detail.
Key UX focus
Seeing cause and effect across systems on one time axis
Context

When an anomaly in one system triggers others, an alarm list hides the chain. Operators need to see order, timing and which system each event came from.

Design challenge

Show a chronological view across several systems that stays readable, lets users filter to what matters, and gives detail for one event without losing the overall sequence.

Users & operational context

Operators monitoring an alarm system.

My role & scope

I structured event and signal information for investigation, established time context, event relationships and the information hierarchy, and designed the interaction and visualisation patterns that take a user from a detected anomaly to detailed investigation. The underlying detection model was not my work.

UX objectives & principles
  • Visualise event sequences across systems to understand cause and effect.
  • Filter by time, severity, system or asset.
  • Severity-based categorisation with impact indicators.
  • Support faster root-cause analysis (design objective).
Information architecture & interaction approach

Summary KPIs sit above the application. Inside, a left navigation separates timeline, alarm list, analysis and shelved alarms. The timeline uses one lane per system with connectors between related events; below it, selected-event details and a numbered event sequence give the focused view.

Key interface decisions
  • One lane per system, so the source of each event is never ambiguous.
  • Connectors between events to show propagation, not just co-occurrence.
  • Timeline and list views offered side by side for different working styles.
  • 'Show normal events' toggle so context can be added without cluttering the default.
Cross-functional considerations

Not documented for this project.

Intended value

Makes event propagation readable on a single time axis. No measured MTTR improvement is documented.

Back to all work

C4Monitoring · Alert visibilitySource: Part 001, p. 13

Anomaly detection interfaces

An alert visibility system, monitor list and trend dashboard for detecting anomalies and prioritising incidents.

Representative screensAdapted for confidentiality

Alert states with distinct icon, colour and label. Redesigned on the shared design system. Values are illustrative, as shown in the source; chart lines are approximate. Sample names and the platform logo are anonymised.
Context
Teams monitoring many data streams and services for anomalies and incidents.
My contribution
Designed an alert visibility system, monitor list and trend views.
Key UX focus
Detect, understand context, prioritise, investigate, act
Context

Data platforms and services produce a steady flow of status changes. Teams need to recognise what matters quickly and see patterns over time.

Design challenge

Make alert states instantly recognisable, give each monitored stream a scannable status, and summarise incident volume, categories and response time.

Users & operational context

Operations and data teams monitoring streams and services. The monitors shown (data quality, API error rate, stream latency) indicate an IT and data-operations context.

My role & scope

I designed dashboard and operational monitoring interfaces focused on alert visibility, issue prioritisation, observability and data-driven decision support.

UX objectives & principles
  • Fast issue recognition through clear alert states.
  • Severity-based prioritisation and grouping.
  • Trend-based analysis of incidents and response time.
Information architecture & interaction approach

A proposed reading of the structure: Detect (alert visibility system) → Understand context (monitor list with source, incidents and recent activity) → Prioritise (status and severity) → Investigate (trends and categories) → Act. This is an explanatory structure based on the screens, not a validated production workflow.

  1. 1Detect
  2. 2Understand context
  3. 3Prioritise
  4. 4Investigate
  5. 5Act
Key interface decisions
  • Four alert states (info, completed, warning, critical) each with its own icon, colour and label.
  • Inline sparklines in the monitor list so recent behaviour is visible without opening a monitor.
  • Response time shown as average, median and 90th percentile rather than a single number.
Visual evidence
Redesigned on the shared design system. Values are illustrative, as shown in the source; chart lines are approximate. Sample names and the platform logo are anonymised.
Trend views for incident volume and response time. Redesigned on the shared design system. Values are illustrative, as shown in the source; chart lines are approximate. Sample names and the platform logo are anonymised.
Cross-functional considerations

Not documented for this project.

Intended value

A transferable pattern for B2B SaaS and data-platform observability as well as industrial operations. Values are illustrative.

Back to all work

C5Monitoring · Event chronologySource: Part 001, p. 14

Sequence timelines

A sequence timeline that lists events, alerts and triggers in order, with severity, category and a detail panel for the selected event.

Representative screensAdapted for confidentiality

Chronological event timeline with detail panel. Redesigned on the shared design system. Values are illustrative, as shown in the source; chart lines are approximate. Sample names and the platform logo are anonymised.
Context
Incident response, where teams need to know what happened and in what order.
My contribution
Designed a chronological event timeline with filters, detail panel and operational summary.
Key UX focus
What happened before and after an incident
Context

During an incident, the order of events is often the most useful information. A timestamped, filterable sequence lets teams reconstruct cause and recovery.

Design challenge

Present a chronological stream that is easy to scan, correlate and filter, and that opens into detail without leaving the sequence.

Users & operational context

Operations and incident-response teams. The example events (server, web tier, auto-scaling) are from an IT operations context.

My role & scope

I designed sequence timeline experiences that help teams monitor events, alerts and triggers in chronological order.

UX objectives & principles
  • Make event progression easy to understand.
  • Correlate related alerts across systems.
  • Severity-based prioritisation.
  • Faster root-cause analysis (intended design objective).
Information architecture & interaction approach

Filters for time range, asset/system and severity sit above a vertical event timeline. Selecting an event opens a detail panel with time, system, severity, category, description and tags. An adjacent operational summary shows active alerts, events over time, category split and response time against goal.

Key interface decisions
  • A connected vertical timeline with severity markers, so sequence and severity are read together.
  • Severity always shown as a labelled pill, not colour alone.
  • Detail panel beside the list, so context is gained without losing position.
  • Response time shown against an explicit goal.
Visual evidence
Illustrative prototype: some sample values on this screen do not reconcile and are not validated results. Operational summary alongside the timeline. Redesigned on the shared design system. Values are illustrative, as shown in the source; chart lines are approximate. Sample names and the platform logo are anonymised.
Cross-functional considerations

Not documented for this project.

Intended value

Clear reconstruction of incidents. Reductions in investigation time are not measured or claimed.

Back to all work

C6Dashboards · Predictive maintenanceSource: Part 001, p. 15

Data-driven operational insights

An operational overview that brings asset health, alerts, uptime, output, impact analysis and maintenance work orders into one view.

Representative screensAdapted for confidentiality

Illustrative prototype: some sample values on this screen do not reconcile and are not validated results. Operational overview; values are representative. Redesigned on the shared design system. Values are illustrative, as shown in the source; chart lines are approximate. Sample names and the platform logo are anonymised.
Context
Operations leadership overseeing asset health, output, risk and maintenance across a site.
My contribution
Designed an operational overview combining live monitoring, trends, risk and work orders.
Key UX focus
Descriptive, diagnostic and predictive views kept distinct
Context

Operations data is spread across monitoring, production and maintenance systems. Decision-makers need a single overview that still shows where to look next.

Design challenge

Present a large volume of operational data through KPI cards, trends and comparisons, and make clear which parts describe the present, which explain a problem and which anticipate risk.

Users & operational context

Operations and maintenance decision-makers.

My role & scope

I designed dashboard and operational monitoring experiences that turn live system data into actionable insights for predictive maintenance, condition monitoring and operational analysis.

UX objectives & principles
  • Identify failure risk early from trend and condition data.
  • Track health, sensor signals and performance in real time.
  • Turn live metrics into data-driven actions.
Information architecture & interaction approach

Descriptive: KPI cards (asset health, active alerts, uptime, response time, energy, maintenance risk), asset status and production output. Diagnostic: downtime by cause and alarms by severity. Predictive: an impact-versus-likelihood matrix and assets ranked by risk score. Actionable: maintenance work orders by status.

Key interface decisions
  • Every KPI paired with a comparison to the previous period.
  • An impact/likelihood quadrant to prioritise risk, with a tooltip showing the underlying scores.
  • 'View details' entry points on each panel instead of cramming detail into the overview.
  • Work orders shown by status (completed, in progress, scheduled, overdue) to link insight to action.
Cross-functional considerations

Not documented for this project.

Intended value

One overview that makes the distinction between monitoring, diagnosis and prediction visible. Values are illustrative.

Back to all work

C7Alarms · Severity systemSource: Part 001, p. 16

Alert & notification design

A four-level alert severity system applied across an active-alarm list, distribution charts and notification channels.

Representative screensAdapted for confidentiality

Illustrative prototype: some sample values on this screen do not reconcile and are not validated results. Generic representation of alert and notification design, per the source note. Redesigned on the shared design system. Values are illustrative, as shown in the source; chart lines are approximate. Sample names and the platform logo are anonymised.
Context
Industrial monitoring where the right alarm must reach the right person at the right time.
My contribution
Designed a four-level severity system and the alarm list and notification views that use it.
Key UX focus
A severity hierarchy that never relies on colour alone
Context

Operators must detect, prioritise and respond to critical issues in real time. Inconsistent severity cues across screens slow that down.

Design challenge

Define a severity hierarchy that is unambiguous, apply it consistently across lists, charts and notifications, and support acknowledgement and escalation.

Users & operational context

Operators in an industrial monitoring system.

My role & scope

I designed alert and notification interfaces that help operators detect, prioritise and respond to critical issues.

UX objectives & principles
  • Consistent severity semantics everywhere an alarm appears.
  • Fast prioritisation through categorisation.
  • Timely, multi-channel notification with acknowledgement and escalation.
Information architecture & interaction approach

Severity summary cards lead, followed by an active-alarm table filterable by severity tab, then distribution, trend and top-source charts. Notifications, escalations and timeline are separate destinations in the navigation.

  • CriticalSystem down or unsafe condition. Immediate action required.
  • HighMajor issue affecting operations. Prompt attention needed.
  • MediumNoticeable issue or performance impact. Monitor and investigate.
  • Low / InfoInformational update or minor change. No immediate action.
Key interface decisions
  • Each level pairs a colour with a distinct icon, a text label and a plain-language meaning.
  • Severity tabs on the alarm list show counts, so users know what a filter will return.
  • Top alarm sources ranked to point at the equipment generating the most noise.
Visual evidence
The four severity levels and their meanings. Redesigned on the shared design system. Values are illustrative, as shown in the source; chart lines are approximate. Sample names and the platform logo are anonymised.
Cross-functional considerations

Not documented for this project.

Intended value

A shared severity language for alarms. Multi-channel delivery (UI, email, SMS, mobile push) is shown as a design capability; implementation is not documented.

Back to all work

C8Alarms · Monitoring & investigationSource: Part 001, p. 17

Alarm systems

A high-visibility alarm dashboard covering active alarms, severity distribution, trends, top sources and recent alarms.

Representative screensAdapted for confidentiality

Alarm monitoring dashboard; values illustrative. Redesigned on the shared design system. Values are illustrative, as shown in the source; chart lines are approximate. Sample names and the platform logo are anonymised.
Context
Industrial operations reviewing active alarms and alarm history across areas.
My contribution
Designed an alarm monitoring dashboard linking overview metrics to the detailed alarm list.
Key UX focus
Overview metrics that lead into the alarm list
Context

Alarm review spans the current state (what is active now) and history (how alarm load has changed and where it comes from).

Design challenge

Make critical alarms easy to identify and act on, while giving enough history to spot recurring sources and time-of-day patterns.

Users & operational context

Industrial operations teams.

My role & scope

I designed clear, high-visibility alarm interfaces for industrial operations.

UX objectives & principles
  • Easy identification and prioritisation of critical alarms.
  • Visibility of alarm sources by area.
  • Historical patterns across days and hours.
Information architecture & interaction approach

Headline metrics (total active, critical, high priority, acknowledgement rate) with sparklines lead into stacked daily alarms, severity split, alarms by area, alarm rate and a time-of-day heatmap. The recent active alarms table closes the page with severity, area, acknowledgement status and duration.

Key interface decisions
  • Acknowledgement status in the table pairs a coloured dot with a text label.
  • Alarm duration shown per row, so long-standing alarms stand out.
  • A compact operational overview variant for smaller panels.
Visual evidence
Illustrative prototype: some sample values on this screen do not reconcile and are not validated results. Compact overview variant. Redesigned on the shared design system. Values are illustrative, as shown in the source; chart lines are approximate. Sample names and the platform logo are anonymised.
Cross-functional considerations

Not documented for this project.

Intended value

A clear relationship between alarm summary and alarm detail. Values are illustrative.

Back to all work

C9Alerts · ConfigurationSource: Part 001, p. 18

Customizable alerts

An alert monitoring and configuration experience that lets teams tailor severity, notification frequency and escalation rules.

Representative screensAdapted for confidentiality

Alert monitoring with configurable rules; values illustrative. Redesigned on the shared design system. Values are illustrative, as shown in the source; chart lines are approximate. Sample names and the platform logo are anonymised.
Context
Teams tuning alert severity, frequency and escalation to their own priorities.
My contribution
Designed alert configuration and monitoring experiences.
Key UX focus
Settings people can understand, adjust and trust
Context

Default alert rules rarely fit every team. If configuration is opaque, people either live with noise or switch alerts off.

Design challenge

Make alert settings understandable and adjustable, with visible feedback on how alert volume and severity change.

Users & operational context

Operators and teams managing alerts. The example alerts (endpoint malware, failed logins, vulnerability scans) indicate an IT security context.

My role & scope

I designed alert configuration experiences that help operators tailor severity, notification frequency and escalation rules.

UX objectives & principles
  • Understandable settings with explicit control.
  • Visible feedback on alert volume and distribution.
  • Safe configuration that does not hide critical alerts.
Information architecture & interaction approach

Filters (time range, area, severity) and an auto-refresh toggle sit above summary cards, alert volume over time and severity split. Recent alerts list status, category, priority, area, time and who acknowledged. Rule creation is a single, clearly labelled primary action.

Key interface decisions
  • Severity filters as labelled chips with colour dots, plus an 'All' option.
  • 'Acknowledged by' column for accountability.
  • 90-day trend and top-category views alongside the live dashboard to inform rule changes.
Cross-functional considerations

Not documented for this project.

Intended value

Configuration that stays connected to its consequences. Specific rule capabilities beyond those shown are not documented.

Back to all work

C10Alarms · AccountabilitySource: Part 001, p. 19

Acknowledgement of active alarms

An acknowledgement flow that captures who acknowledged an alarm, when, why and what was done, with a visible history.

Representative screensAdapted for confidentiality

Generic representation per the source note; values illustrative. Redesigned on the shared design system. Values are illustrative, as shown in the source; chart lines are approximate. Sample names and the platform logo are anonymised.
Context
Operators acknowledging alarms across shifts, where 'who handled this, and how?' must be clear.
My contribution
Designed the acknowledgement flow: required comments, actions taken, user identification and history.
Key UX focus
Structured confirmation that removes doubt about alarm state
Context

An alarm that may or may not have been handled is a risk in itself. Teams working across shifts need a clear record.

Design challenge

Make acknowledgement quick enough for real operations, while capturing enough context for accountability and handover.

Users & operational context

Operators and teams working across shifts.

My role & scope

I enabled operators to acknowledge active alarms with mandatory comments, actions taken and user identification.

UX objectives & principles
  • Clear accountability for every acknowledgement.
  • Faster acknowledgement and resolution (intended outcome).
  • Context for teams across shifts.
Information architecture & interaction approach

The active alarm list filters by acknowledgement state. Selecting an alarm opens a side panel with severity, time, message, current value and threshold, followed by required fields (acknowledged by, comments, actions taken) and an optional attachment. A history timeline below records each state change.

Key interface decisions
  • Required fields marked explicitly, so the operator knows what is needed before submitting.
  • Current value shown next to threshold, so the reason for the alarm is visible in the form.
  • Cancel and Acknowledge as clearly separated actions.
  • Acknowledgement history as a timeline, linking comments and actions to each step.
Cross-functional considerations

Not documented for this project.

Intended value

Reduces ambiguity about whether and how an alarm was handled. Regulatory compliance is not established and is not claimed.

Back to all work

Diagnostics, root-cause analysis & information flow

Investigation tools that structure the path from an observed problem to a recommended action.

D1Diagnostics · RCASource: Part 001, p. 20

Diagnostic root-cause analysis overview

An RCA overview that frames investigation as a six-step workflow and summarises top causes, trends and recent cases.

Representative screensAdapted for confidentiality

Generic representation per the source note. The '24% MTTR improvement' card is illustrative, not a result. Redesigned on the shared design system. Values are illustrative, as shown in the source; chart lines are approximate. Sample names and the platform logo are anonymised.
Context
Operators investigating recurring alarms and issues across systems and assets.
My contribution
Designed an RCA overview: workflow, analysis dashboard and case history.
Key UX focus
Observation to structured investigation to recommendation
Context

Recurring issues often share causes that are only visible across time, systems and past cases.

Design challenge

Help operators identify underlying causes by looking at temporal patterns, deviations and related events, and connect findings to actions.

Users & operational context

Operators and reliability teams.

My role & scope

I designed the information hierarchy, the visible investigation workflow, the presentation of top causes, occurrence trends and insights, and the recent-case view. Analytics and implementation were outside my scope.

UX objectives & principles
  • Event correlation and causal analysis.
  • Timeline reconstruction and impact assessment.
  • Action recommendations to prevent recurrence.
Information architecture & interaction approach

The workflow is shown explicitly as a sequence, so the dashboard always communicates where in an investigation the user is.

  1. 1Detect issue
  2. 2Collect data
  3. 3Correlate events
  4. 4Identify root cause
  5. 5Recommend actions
  6. 6Monitor & validate
Key interface decisions
  • The investigation workflow is visible on the page, not hidden in a process document.
  • Top root causes and their occurrence over time shown together.
  • Plain-language insights summarise patterns (for example, by shift).
  • Recent RCA cases list root cause, impact and resolution status.
Cross-functional considerations

Not documented for this project.

Intended value

A visible investigation workflow that connects analysis to action.

Back to all work

D2Diagnostics · Investigation aidSource: Part 002, p. 1

Interactive root-cause analysis

An interactive cause map that lets users explore contributing factors across six categories and trace an incident back to its root cause.

Representative screensAdapted for confidentiality

Generic representation per the source note. Redesigned on the shared design system. Values are illustrative, as shown in the source; chart lines are approximate. Sample names and the platform logo are anonymised.
Context
Investigating a specific incident: high pressure in a boiler.
My contribution
Designed an interactive cause map with investigation flow, evidence and recommended actions.
Key UX focus
Exploring contributing factors and tracing them to a cause
Context

Root-cause investigations involve many possible contributing factors. Teams need a structure for exploring them and a record of how the cause was reached.

Design challenge

Make a cause-and-effect investigation interactive and traceable: show candidate causes by category and impact, explain why one was selected, and connect it to actions and related incidents.

Users & operational context

Operations and reliability teams investigating incidents.

My role & scope

I designed the information hierarchy and interaction patterns for root-cause exploration: the cause map, the presentation of diagnostic evidence behind a selected cause, and the recommended-action and related-incident views. The analysis behind the suggestions was outside my scope.

UX objectives & principles
  • Visualise an issue and its possible contributing factors.
  • Trace problems back across components, processes and systems.
  • Make the reasoning behind a selected cause explicit.
Information architecture & interaction approach

A cause map (fishbone structure) organises candidate causes into Materials, Processes, People, Methods, Environment and Machines, each marked by impact level. The left panel records investigation progression from alert to resolution. Beneath the map: the selected root cause, why it was selected with supporting evidence, recommended actions and related incidents.

Key interface decisions
  • Six standard cause categories so investigations are comparable.
  • Impact level marked on each candidate cause, with a legend.
  • A 'why is this the root cause?' panel that lists supporting evidence.
  • Investigation flow with timestamps and a workflow status, so the record is complete.
Visual evidence
Investigation progression for the incident. Redesigned on the shared design system. Values are illustrative, as shown in the source; chart lines are approximate. Sample names and the platform logo are anonymised.
Cross-functional considerations

Not documented for this project.

Intended value

A diagnostic investigation aid. The confidence score shown is illustrative; the source does not establish that AI independently determined the root cause.

Back to all work

D3Diagnostics · AI-assisted analysisSource: Part 002, p. 2

AI-assisted diagnostic investigation

An investigation interface in which an analysis assistant proposes candidate causes, the supporting evidence is shown separately, and a qualified person confirms or rejects the hypothesis.

Reconstructed conceptAdapted for confidentiality

Representative concept / reconstructed for portfolio clarity. Not the original shipped screen. Illustrative data. Replaces the source image, whose panels contained unrelated content (see the asset manifest). Open the interactive HTML screen
Context
An investigation where an analysis assistant suggests causes and a person decides.
My contribution
Designed the interface for AI-assisted diagnosis. Interface scope; model work is not claimed.
Key UX focus
Keeping evidence, interpretation and the human decision visibly separate
Context

AI-assisted diagnosis is only useful if people can see what was observed, what the system is suggesting, and what remains for them to decide.

Design challenge

Integrate automated diagnostic assistance into the investigation flow without letting a suggestion read as a confirmed root cause.

Users & operational context

Operations and engineering teams investigating an alarm. Specific roles are not documented in the source.

My role & scope

The source states I integrated AI algorithms into the design to automate parts of the diagnostic process. This is read as interface and workflow design for AI-assisted analysis; building, training or validating models is not claimed. The screen below is a portfolio reconstruction, not the original deliverable.

UX objectives & principles
  • Support the investigation process with automated assistance.
  • Make complex diagnostic information easier to navigate.
  • Show confidence and status alongside every AI finding.
Information architecture & interaction approach

The reconstructed screen reads top to bottom as an investigation: the event summary; correlated signals on one time axis; the evidence list (observed signals, derived correlation, maintenance record); candidate hypotheses marked as proposed; a human-review stepper with confirm, reject and request-more-data actions; and next steps that require approval.

Key interface decisions
  • Evidence and interpretation are shown in separate panels, so an observation is never mistaken for a conclusion.
  • No confidence or likelihood score is displayed, because none has been validated; the assistant's suggestion is labelled as a suggestion.
  • A visible human-review step with an explicit reject path back to evidence review.
  • Proposed actions are gated on confirmation rather than offered as instructions.
Cross-functional considerations

Not documented for this project.

Intended value

Intended to make AI suggestions reviewable and to keep the decision with a qualified person. No accuracy, confidence or time saving is claimed.

Next steps

If an anonymised original diagnostics screen can be shared, add it beside the reconstruction and label each clearly.

Back to all work

D4Information architecture · Investigation journeySource: Part 002, p. 3

User-centric information flow: the investigation journey

An information flow that takes people from a detected signal to its cause and a recorded outcome, distinguishing what the system assists from what a person decides.

Reconstructed concept

Representative concept / reconstructed for portfolio clarity. Not the original shipped screen. Illustrative data. Replaces the source diagram, which showed a generic app journey (login, orders). Open the interactive HTML screen
Context
Guiding people from a detected signal to a recorded outcome, without losing context.
My contribution
Designed the information flow and the principles behind it.
Key UX focus
Detect, explore, diagnose, resolve, with the human decisions made explicit
Context

Investigations fail when people don't know the next step, lose context while exploring related data, or cannot tell a system suggestion from a decision.

Design challenge

Design an easy-to-follow path that keeps users oriented and surfaces relevant information at the right time.

Users & operational context

Operators and engineers investigating an alert. The source describes guiding users from the detection of a problem to its root cause.

My role & scope

I designed an easy-to-follow flow that guides users from the detection of a problem to its root cause.

UX objectives & principles
  • Clear pathways where every step leads closer to resolution.
  • Minimal cognitive load through grouping and progressive disclosure (design objective).
  • User control: explore related areas without losing context.
  • Faster decisions (intended goal).
Information architecture & interaction approach

Seven stages grouped under the source's four phases (Detect, Explore, Diagnose, Resolve): signal detected, signals correlated, affected asset inspected, evidence and hypotheses reviewed, a qualified person decides, action and hand-off recorded, outcome captured. Each stage is marked as system assistance, a human step, or system-proposes-person-reviews, and names the case studies that show it. Rejecting a hypothesis loops back to evidence review.

  1. 1Detect
  2. 2Explore
  3. 3Diagnose
  4. 4Resolve
Key interface decisions
  • Human steps and decision points carry a heavier outline than system-assistance steps, so responsibility is visible without colour.
  • A single explicit loop (reject → evidence review) instead of an open-ended return path.
  • Each stage links to the case studies that show it, so the flow ties the alarm, timeline and RCA work together.
Cross-functional considerations

Not documented for this project.

Intended value

A designed concept that connects the alarm, timeline and RCA case studies into one journey. No validation evidence is documented.

Back to all work

Asset health, maintenance & AI vision

Condition monitoring, maintenance planning and machine-vision interfaces for keeping equipment running.

E1Embedded HMI · Preventive maintenanceSource: Part 002, p. 4

Industrial asset health monitoring

Embedded HMI screens that help operators track equipment condition, detect early risk signals and prioritise maintenance.

Representative screensAdapted for confidentiality

Illustrative prototype: some sample values on this screen do not reconcile and are not validated results. Embedded HMI concept; values illustrative. Redesigned on the shared design system. Values are illustrative, as shown in the source; chart lines are approximate. Sample names and the platform logo are anonymised.
Context
Embedded HMIs where operators track equipment condition and plan maintenance.
My contribution
Designed embedded monitoring interfaces for condition, early risk and maintenance priority.
Key UX focus
Health, risk and maintenance due, before failures affect operations
Context

Preventive maintenance depends on spotting degradation early. On an embedded HMI, space is limited and the screen must be readable at a glance.

Design challenge

Fit overall health, monitored assets, critical alerts and maintenance due into a compact, dark HMI while keeping a clear order of attention.

Users & operational context

Operators and maintenance teams using embedded HMIs.

My role & scope

I designed embedded monitoring interfaces that help operators track equipment condition, detect early risk signals and prioritise maintenance actions.

UX objectives & principles
  • Real-time visibility of asset condition.
  • Early risk detection through thresholds.
  • Maintenance effort focused on what matters most.
Information architecture & interaction approach

Four summary tiles (overall health, assets monitored, critical alerts, maintenance due) sit above a health trend and health distribution. Below, assets ranked by health score and recent alerts with severity close the loop to action.

Key interface decisions
  • Each summary tile pairs a number with a status word (Good, Action required, This week).
  • Health bands defined explicitly in the legend (good, fair, poor) with their score ranges.
  • Assets ranked by health score with a trend sparkline, so declining assets stand out.
Cross-functional considerations

Not documented for this project.

Intended value

Supports proactive maintenance decisions. Uptime and readiness figures shown in the source are illustrative.

Back to all work

E2Embedded HMI · Multi-machine statusSource: Part 002, p. 5

Preventive maintenance HMI

Embedded HMI screens with a machine status overview that makes healthy, warning and alert states easy to compare.

Representative screensAdapted for confidentiality

Illustrative prototype: some sample values on this screen do not reconcile and are not validated results. Generic representation per the source note. Redesigned on the shared design system. Values are illustrative, as shown in the source; chart lines are approximate. Sample names and the platform logo are anonymised.
Context
Maintenance teams scanning twelve machines to see which need attention.
My contribution
Designed embedded status screens with a consistent machine-card layout.
Key UX focus
Consistent cards that make comparison instant
Context

When many similar machines run side by side, maintenance teams need to see at a glance which ones deviate.

Design challenge

Show several readings per machine across a fleet, and make it obvious which machines need attention and why.

Users & operational context

Maintenance teams.

My role & scope

I designed embedded HMI screens that offer real-time status monitoring of critical equipment for maintenance planning.

UX objectives & principles
  • Real-time monitoring of critical parameters.
  • Proactive alerts with thresholds.
  • Clear maintenance prioritisation.
Information architecture & interaction approach

Each machine card uses the same layout: name, alert badge, and four readings (pressure, vibration, temperature, gas flow). Out-of-range readings are highlighted within the card. Grid and list views and group filters support different fleet sizes; a dark plant overview summarises the whole site.

Key interface decisions
  • Identical card structure so differences read as data, not layout.
  • Card border and badge reflect machine state; the badge also states the alert count in text.
  • The specific deviating reading is highlighted, so the reason for the state is visible.
Visual evidence
Illustrative prototype: some sample values on this screen do not reconcile and are not validated results. Site-level plant overview. Redesigned on the shared design system. Values are illustrative, as shown in the source; chart lines are approximate. Sample names and the platform logo are anonymised.
Cross-functional considerations

Not documented for this project.

Intended value

Fast fleet comparison. The meaning of individual readings beyond those legible is not documented.

Back to all work

E3Enterprise UX · Work managementSource: Part 002, p. 6

Maintenance dashboard & interaction design

A maintenance dashboard and list that combine work-order visibility, scheduling and status in reusable, action-oriented patterns.

Representative screensAdapted for confidentiality

Illustrative prototype: some sample values on this screen do not reconcile and are not validated results. Indicative image; the source notes originals cannot be shared. Redesigned on the shared design system. Values are illustrative, as shown in the source; chart lines are approximate. Sample names and the platform logo are anonymised.
Context
Maintenance teams scheduling work orders and tracking equipment due for service.
My contribution
Created interactive designs for monitoring equipment and scheduling maintenance.
Key UX focus
Reusable, action-oriented table patterns

Sample names and the avatar are redacted. Record numbers still repeat and costs are sample values; captions mark data illustrative.

Context

Maintenance management is a classic enterprise workflow: many records, statuses and priorities, with a need to act on them quickly.

Design challenge

Give maintenance teams an overview of what is due and a list they can filter, sort and act on.

Users & operational context

Maintenance teams and leads.

My role & scope

I created interactive designs for maintenance teams to monitor equipment health and schedule maintenance proactively.

UX objectives & principles
  • Work-order and equipment-due visibility.
  • Clear status and priority.
  • Efficient actions from the list.
Information architecture & interaction approach

Summary cards (equipment due, low inventory, work orders, purchase orders, maintenance cost) lead into a maintenance list with due date, status, priority, cost and row actions, plus filter, reset and pagination. An overview variant adds maintenance trend and category breakdown.

Key interface decisions
  • Status pills and priority dots both carry text labels.
  • Filter and reset placed together above the table.
  • Row selection for bulk actions; a single 'Add new' primary action.
Visual evidence
Illustrative prototype: some sample values on this screen do not reconcile and are not validated results. Overview variant; indicative. Redesigned on the shared design system. Values are illustrative, as shown in the source; chart lines are approximate. Sample names and the platform logo are anonymised.
Cross-functional considerations

Not documented for this project.

Intended value

Reusable enterprise table and status patterns that transfer directly to other B2B work-management products.

Back to all work

E4AI vision · HMISource: Part 002, p. 7

Artificial vision for equipment monitoring & maintenance

HMI designs that bring camera feeds and machine-vision analysis into equipment monitoring, alerting and maintenance.

Reconstructed conceptAdapted for confidentiality

Representative concept / reconstructed for portfolio clarity. Not the original shipped screen. Illustrative data. Camera views are schematic placeholders. Replaces the source image, whose camera photographs and avatar have unconfirmed rights. Open the interactive HTML screen
Context
Camera-based monitoring of motors, conveyors, robot arms, pumps and panels.
My contribution
Designed HMI interfaces for artificial-vision monitoring: live feeds, alerts and anomaly trends.
Key UX focus
Relating camera feeds to alerts, assets and trends
Context

Camera feeds can reveal conditions sensors miss, but a wall of video is not a monitoring tool. The feed must be connected to status, alerts and equipment.

Design challenge

Show live visual monitoring alongside alert summaries, equipment status and anomaly trends, so a detection can be understood and acted on.

Users & operational context

Maintenance leads and operators.

My role & scope

I designed HMI interfaces for real-time equipment monitoring using camera-based artificial vision. The vision models themselves were not my work.

UX objectives & principles
  • Real-time visual monitoring.
  • Anomaly detection and actionable insight.
  • Support for predictive maintenance and safety monitoring (intended use contexts).
Information architecture & interaction approach

Summary cards (monitored equipment, active alerts, anomalies, uptime, inspections) lead to a grid of labelled camera feeds, each with a status tag. Recent alerts and an anomaly trend sit alongside. A use-case strip frames where the capability applies.

Key interface decisions
  • Every camera feed labelled with the asset name and a text status (Normal, Anomaly).
  • Detection regions drawn on the feed, with the anomalous feed highlighted.
  • Recent alerts beside the feeds, so the alert and the image can be compared.
Cross-functional considerations

Not documented for this project.

Intended value

Makes visual detections part of the monitoring workflow. No specific vision model, accuracy level or production deployment is claimed.

Back to all work

E5AI vision · Detection reviewSource: Part 002, p. 8

Real-time visual monitoring

An industrial visual-monitoring interface: camera health, a list of detected events with review status, and a selected-event panel where the operator confirms or dismisses a detection.

Reconstructed conceptAdapted for confidentiality

Representative concept / reconstructed for portfolio clarity. Not the original shipped screen. Illustrative data. Camera views are schematic placeholders, not footage. Replaces the source image, whose panels showed customer-support and order data. Open the interactive HTML screen
Context
Watching equipment through fixed cameras, where every detection still needs a person to check it.
My contribution
Designed interfaces that show real-time equipment imagery from artificial-vision systems.
Key UX focus
Camera health, detections and review state in one view
Context

Artificial-vision monitoring produces a stream of detections. They are only useful if operators can see which cameras are healthy, which events need review, and the evidence behind each one.

Design challenge

Present camera status, detections and evidence so an operator can confirm or dismiss each event quickly, without treating a model output as a confirmed fault.

Users & operational context

Operators visually monitoring machinery (per the source). Other roles are not documented.

My role & scope

I designed interfaces that display real-time images and videos of equipment, powered by artificial vision, so operators can visually monitor machinery. The screen below is a portfolio reconstruction of that experience, not the original deliverable.

UX objectives & principles
  • Continuous visual monitoring.
  • Anomaly visibility.
  • Operational context for faster response.
Information architecture & interaction approach

Status metrics lead (cameras online, degraded and offline; events awaiting review). A camera grid shows each feed with a text and icon status. The event table lists time, camera or asset, event, severity and review status (detected, under review, confirmed, dismissed). The selected-event panel shows the evidence frame with the detection region, the event details and the confirm or dismiss decision.

Key interface decisions
  • Camera health (online, degraded, offline) shown with text and icon, so a missing feed is never mistaken for 'no events'.
  • Four review states keep model detections separate from confirmed faults; dismissals record a reason.
  • The selected event states plainly that it is a model detection, not a confirmed fault.
  • Camera tiles reuse the label-plus-status pattern from E4, keeping the vision cases consistent.
Cross-functional considerations

Not documented for this project.

Intended value

Intended to make visual detections quick and safe to review. No detection accuracy, uptime or response-time result is claimed.

Back to all work

E6AI vision · Detection UXSource: Part 002, p. 9

AI-powered object recognition

An HMI view that presents object-recognition results (wear, cracks, leaks, loose parts) on a 3D site model with category, zone and severity summaries.

Representative screensAdapted for confidentiality

Screen withheld pending image-rights confirmation
Screen withheld from the public portfolio until image rights are confirmed (stock-style avatar, photographic or rendered imagery, or third-party product names). The original file is preserved.
Context
Showing wear, cracks, leaks and loose parts detected by object recognition on the HMI.
My contribution
Designed how AI-based object-recognition results are presented in the HMI screen.
Key UX focus
Making machine-generated observations understandable

Visual withheld until rights to the rendered scene and avatar are confirmed (Q5).

Context

Detection results are only actionable if users can see where the issue is, what kind it is, how certain the system is and what to do next.

Design challenge

Present machine-generated observations so they are understandable and actionable, and do not read as confirmed facts.

Users & operational context

Maintenance leads.

My role & scope

I designed how AI-based object-recognition results, such as wear or malfunctioning parts, are surfaced in the HMI screen. The recognition model itself was not my work.

UX objectives & principles
  • Real-time issue visibility on the HMI.
  • Clear detection categories and locations.
  • Actionable next steps from a detection.
Information architecture & interaction approach

A 3D or camera view anchors the screen, with a detection overlay and callout (machine, part, issue, confidence, view details). Left: detections over time, by type and by confidence band. Right: defects by category, detections by zone and alerts by severity. Environmental gauges sit beneath the model, and a 'how it works' strip explains the pipeline from capture to preventive action.

  1. 1Image capture
  2. 2AI analysis
  3. 3Issue identification
  4. 4Alert & notification
  5. 5Preventive action
Key interface decisions
  • Detection callout names the machine, part and issue in words, not just a box on an image.
  • Detections grouped by confidence band, so uncertain results are visible as a category.
  • 3D and camera views as explicit toggles.
Cross-functional considerations

Not documented for this project.

Intended value

Makes AI detections legible. Confidence values and accuracy claims shown are illustrative; no model performance is claimed.

Next steps

Opportunity: distinguish detection, uncertain result and operator-confirmed issue as separate visual states.

Back to all work

E7AI alerting · ThresholdsSource: Part 002, p. 10

Maintenance triggers

An alerting view that shows actual metrics against a predicted and allowed range, marks when alerts fire and resolve, and lists active alert rules.

Representative screensAdapted for confidentiality

Values are illustrative, not validated sensor measurements. Redesigned on the shared design system. Values are illustrative, as shown in the source; chart lines are approximate. Sample names and the platform logo are anonymised.
Context
Alerting operators when visual or sensor data indicate that maintenance is needed.
My contribution
Designed AI-triggered alerts and the chart and rule views that explain them.
Key UX focus
Showing why an alert fired: metric, range, time and next action
Context

A maintenance alert is only trusted if users can see what triggered it. Dynamic thresholds make this harder, because the limit moves.

Design challenge

Show the triggering condition, the measurement, the time context, severity and the next available action in one view.

Users & operational context

Operators and maintenance teams.

My role & scope

I designed the alert experience for AI-triggered maintenance alerts based on visual data analysis, so operators are notified when maintenance is required. The detection logic itself was not my work.

UX objectives & principles
  • Explain each alert through its triggering condition.
  • Make dynamic thresholds understandable.
  • Connect alerts to maintenance windows and rules.
Information architecture & interaction approach

A metric chart shows the actual value, predicted range and allowed range, with alert-fired, active and resolved periods shaded and annotated. Hovering shows the upper and lower limits at that point. Beneath, active alert rules list metric, condition, threshold, duration, severity, status and trigger time.

Key interface decisions
  • Annotated chart states ('fired', 'active', 'resolved') so the alert lifecycle is visible on the data.
  • Hover detail shows the dynamic limits at a point in time.
  • Rules table makes each threshold and duration explicit.
Cross-functional considerations

Not documented for this project.

Intended value

Alerts that explain themselves. Dynamic-threshold learning is described as a capability; implementation is not documented.

Back to all work

Design systems & industrial UX standards

Most of the screens in this portfolio were produced for an industrial intelligence platform. Beyond individual screens, my design-system contribution was a governance responsibility within a wider team, not sole ownership of the system:

  • HMI colour documentation for version 2.0 of the platform: system-wide colour standards for UI elements, dashboards and HMI screens, applied consistently across interfaces and in light and dark themes.
  • Reusable design patterns and organised design assets through the HMI design repository.
  • Asset-handling and implementation SOPs for SVG, PNG, GIF and interface status indicators, and backend-driven status-tag conventions.
  • Implementation validation and localization checks for spacing and alignment, with value-engineering, product and full-stack teams.

Reusable HMI experience patterns

Patterns I helped standardise and reuse, and the job each one does.

PatternDesign purposeSeen in
Operational cardsConsistency: one card anatomy (label, value, status word, comparison) for every KPI tile.E1, C6
Equipment panelsComprehension: identical layout per machine so differences read as data, not layout.E2
KPI displaysReduced ambiguity: every value paired with unit, timeframe and comparison period.C1, B4
Process-flow interfacesComprehension: show where an asset sits in the process and where instruments are.B3
Alert & notification statesReduced ambiguity: four severity levels, each with colour, icon and text.C7, C10
NavigationReuse: a shared left-rail structure for monitoring, alarms, analysis and settings.C3, C7
Data visualizationImplementation clarity: consistent time-range controls, legends and severity series colours.C8, E7
Equipment monitoringReuse: asset-plus-callout layouts that tie readings to physical location.B4, E4
Digital-twin representationsComprehension: a fidelity scale from realistic render to simplified PFD.B2, B3

Colour & theme documentation

Tokens give components, dashboards and HMI screens one vocabulary. Brand and neutral colours carry structure; semantic colours carry meaning and are always paired with a label or icon. The two palettes below are the ones documented in the original case-study material. This site itself uses the version 2.1 design-system tokens shown last: the official light values, plus a dark theme derived from the same purple and grey scales.

Light theme

  • #FFFFFFSurface, page
  • #333333Text, charcoal
  • #A055F5Purple accent
  • #7500C0Purple, deep
  • #A100FEPurple, vivid
  • #A966F6Purple, soft
  • #008731Success
  • #EB5757Error

Dark HMI theme

  • #0E1736Background
  • #212F7CPrimary blue
  • #374D9DSecondary blue
  • #202B6DAsset box
  • #324288HMI frame
  • #00BFFFPipeline blue
  • #50CB7ASuccess
  • #FFBB61Warning
  • #EE3D30Anomaly
  • #6C92C5Simulation
  • #EBEBEBPrimary text
  • #C0C0C0Grey
  • #A4D2D4Supporting accent

Design system v2.1 tokens (used by this site)

  • #631BDBBrand primary
  • #451399Hover, secondary
  • #280B58Selected, pressed
  • #F0E8FCPurple 50
  • #FDFFFFPrimary surface
  • #333333Primary text
  • #474747Secondary text
  • #2DBA52Success
  • #E19000Warning
  • #F0464ADanger
  • #8249E2Info

Industrial asset standards

  • Consistent orientation and viewing angle across an asset family.
  • Relative scale and proportions preserved between assets shown together.
  • Consistent canvas dimensions, alignment and anchor position.
  • Transparent backgrounds wherever the asset sits on a themed surface.
  • Thumbnails cropped and padded to the same rules as full assets.
  • SVG where practical; PNG where an SVG is unsuitable (photographic or heavy renders).
  • Replacement assets keep the original's dimensions, alignment and placement.
  • When an animated GIF is replaced by a PNG, the PNG matches the GIF's dimensions, proportions, alignment and placement, so the layout does not shift.

SVG gradient consistency

For the relevant HMI SVG assets, gradients use one fixed coordinate set so assets rendered at the HMI frame size shade identically. This is an asset-specific implementation standard, not a rule for every graphic.

<linearGradient gradientUnits="userSpaceOnUse"
  x1="923.5" y1="0" x2="923.5" y2="1074">

Status mapping & motion

Equipment states are driven by backend status tags. The design specification defines what each state looks like and how it moves; the tag drives which state is shown. Tags follow the naming convention $_$_<Status Tag Name>.

StateTokenNon-colour cueMotion
Running--status-successCheck icon, "Running" labelEquipment animation (GIF) plays
Warning--status-warningCircle icon, "Warning" labelAnimation plays; no flashing
Alarm--status-anomalyTriangle icon, "Alarm" labelStatic PNG replaces GIF; layout unchanged
Recommendation--status-simulationBulb icon, "Recommendation" labelNo motion

Motion never carries status on its own; every state also has a label and icon.

Design QA & localization

  • Spacing and alignment checked against the token scale.
  • Status colours verified against the specification in both themes.
  • Component states consistent across screens.
  • Status-tag mapping checked: each tag drives the intended visual state.
  • Replaced assets validated for size and position.
  • Annotated specifications for implementation handoff.
  • Theme compatibility checked in light and dark.

Text expansion check (English to Portuguese)

Portuguese strings often run longer than English. Labels are tested at their translated length so they wrap or truncate predictably instead of breaking a component.

ENAcknowledge alarmMaintenance due
PTReconhecer alarmeManutenção pendente

The system in use

One equipment card, built from the tokens above, rendered in both themes. The severity scale beneath is the one used across the alarm case studies.

Light

Compressor C-203
Warning
Pressure
1,200 psi
Vibration
10 Hz
Temperature
350 °CAbove range
Gas flow
2.4 kg/s

Illustrative values

Dark

Compressor C-203
Warning
Pressure
1,200 psi
Vibration
10 Hz
Temperature
350 °CAbove range
Gas flow
2.4 kg/s

Illustrative values

Type scale

  • Hero 56Desktop 48–64 / mobile 34–42
  • Section 3632–40 / 27–32
  • Card title 2018–22 / 17–20
  • Body 1716–18 / 16
  • Label 1312–14

Severity scale

  • CriticalSystem down or unsafe condition. Immediate action required.
  • HighMajor issue affecting operations. Prompt attention needed.
  • MediumNoticeable issue or performance impact. Monitor and investigate.
  • Low / InfoInformational update or minor change. No immediate action.

Capabilities

Industrial work is my strongest differentiator, but the skills underneath it are the same ones that make any product clear: information architecture, task-oriented workflows, feedback, progressive disclosure and consistent patterns.

  • Enterprise & B2B product experience

    Complex workflows and information architecture, enterprise dashboards, operational monitoring and decision support, interactive prototypes and proof-of-value concepts, and alignment with technical stakeholders.

  • Industrial UX

    HMI design, Industrial AI and manufacturing intelligence, digital twins and asset visualization, real-time equipment monitoring, alarm management and diagnostics, predictive maintenance and condition monitoring.

  • Design-system thinking

    Reusable Figma components and interaction patterns; consistent colour, type, spacing and states; asset standards; documentation and handoff; visual QA and localization checks.

  • UX leadership behaviours

    Framing problems and analysing workflows; giving design direction with clear rationale; holding quality standards through reviews and QA; coordinating teams through demo delivery; and balancing user needs, business goals and technical constraints.

How this work transfers to consumer products

This portfolio does not include consumer-product case studies. These are the principles demonstrated in the work, and how each applies to B2C experiences.

PrincipleWhere it's shownIn a consumer product
Clear navigation & hierarchyA central hub with direct routes to activities, notifications and orders (D4)App home screens and tab structures that keep key tasks one step away.
OnboardingSplash, login and registration designed as explicit branches (D4)Sign-up and first-run flows where edge cases are designed, not discovered.
Progressive disclosureAlarm summary to event context to action (C2); overview to subsystem (A2)Order summaries that open into tracking detail only when needed.
Feedback & error preventionRequired fields and a clear confirm step for acknowledgement (C10)Checkout and account changes that confirm what happened and prevent mistakes.
Understandable settingsAlert rules connected to their effect on alert volume (C9)Notification preferences people can tune without switching everything off.
DiscoverabilityFilters by time, severity and system; counts on tabs (C3, C7)Search and filtering that tells people what they'll get before they tap.
Accessible statusSeverity shown by colour, icon and text together (C7)Order and payment states that don't depend on colour perception.

Design approach

A repeatable way of working that I adapt to the project. Not every project follows every step formally; proof-of-value work, for example, compresses them into days.

  1. Understand

    The user, the operational context and the actual problem, including the constraints the equipment or data impose.

  2. Structure

    The workflow and information: what must be visible now, what supports investigation, and what needs deliberate confirmation.

  3. Explore & prototype

    Concepts at the right fidelity, from layered maps to clickable, scenario-driven prototypes.

  4. Align

    With engineering, product, domain and business stakeholders, so the design is feasible and the narrative holds.

  5. Refine

    Interface clarity and consistency, using shared patterns, tokens and severity semantics.

  6. Review

    Implementation quality through design QA, and capture what to learn for the next iteration.

Design impact summary

My portfolio centres on industrial intelligence platforms and AI-enhanced HMI design, bringing machine vision and real-time monitoring into complex industrial systems. The aim throughout is to help operators detect anomalies, make informed maintenance decisions and avoid unplanned downtime.

  • Simplified complex industrial workflows
  • Proactive maintenance decision support
  • Clearer anomaly visibility and diagnostics
  • Data-rich, operator-friendly interfaces
  • Machine-vision monitoring experiences
  • Shared HMI patterns and standards

Let's talk

I'm open to senior industrial UX, enterprise product design and UX lead conversations, especially for industrial or AI-enabled products.